

Question: With the income statement pic 1, how can I make an Advanced financial setup like pic 2? The number of Income before taxes and income
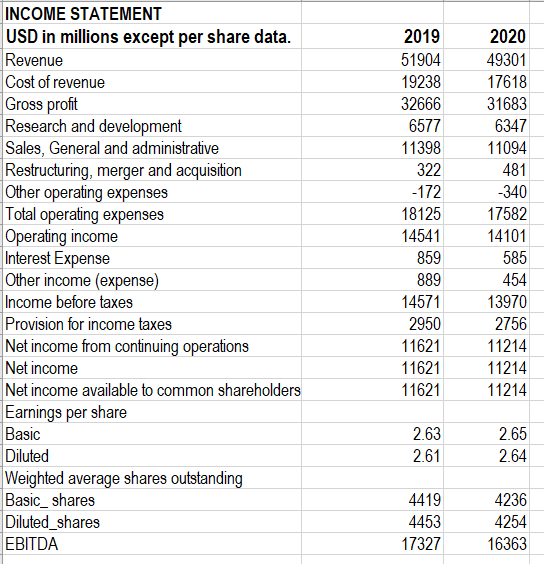
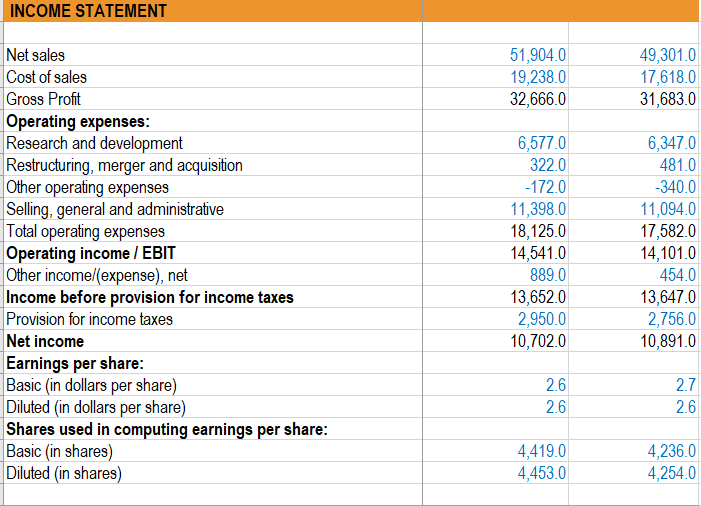
With the income statement pic 1, how can I make an Advanced financial setup like pic 2?
The number of Income before taxes and income before provision for income taxes should match
Also, the number of Net income should match.
INCOME STATEMENT USD in millions except per share data. Revenue Cost of revenue Gross profit Research and development Sales, General and administrative Restructuring, merger and acquisition Other operating expenses Total operating expenses Operating income Interest Expense Other income (expense) Income before taxes Provision for income taxes Net income from continuing operations Net income Net income available to common shareholders Earnings per share Basic Diluted Weighted average shares outstanding Basic_ shares Diluted_shares EBITDA 2019 51904 19238 32666 6577 11398 322 -172 18125 14541 859 889 14571 2950 11621 11621 11621 2020 49301 17618 31683 6347 11094 481 -340 17582 14101 585 454 13970 2756 11214 11214 11214 2.63 2.61 2.65 2.64 4419 4453 17327 4236 4254 16363 INCOME STATEMENT 51,904.0 19,238.0 32,666.0 49,301.0 17,618.0 31,683.0 Net sales Cost of sales Gross Profit Operating expenses: Research and development Restructuring, merger and acquisition Other operating expenses Selling, general and administrative Total operating expenses Operating income / EBIT Other income/expense), net Income before provision for income taxes Provision for income taxes Net income Earnings per share: Basic (in dollars per share) Diluted (in dollars per share) Shares used in computing earnings per share: Basic (in shares) Diluted (in shares) 6,5770 322.0 -172.0 11,398.0 18,125.0 14,541.0 889.0 13,652.0 2,950.0 10,702.0 6,347.0 481.0 -340.0 11,094.0 17,582.0 14,101.0 454.0 13,647.0 2,756.0 10,891.0 2.6 2.6 2.7 2.6 4,419.0 4,453.0 4,236.0 4,254.0 INCOME STATEMENT USD in millions except per share data. Revenue Cost of revenue Gross profit Research and development Sales, General and administrative Restructuring, merger and acquisition Other operating expenses Total operating expenses Operating income Interest Expense Other income (expense) Income before taxes Provision for income taxes Net income from continuing operations Net income Net income available to common shareholders Earnings per share Basic Diluted Weighted average shares outstanding Basic_ shares Diluted_shares EBITDA 2019 51904 19238 32666 6577 11398 322 -172 18125 14541 859 889 14571 2950 11621 11621 11621 2020 49301 17618 31683 6347 11094 481 -340 17582 14101 585 454 13970 2756 11214 11214 11214 2.63 2.61 2.65 2.64 4419 4453 17327 4236 4254 16363 INCOME STATEMENT 51,904.0 19,238.0 32,666.0 49,301.0 17,618.0 31,683.0 Net sales Cost of sales Gross Profit Operating expenses: Research and development Restructuring, merger and acquisition Other operating expenses Selling, general and administrative Total operating expenses Operating income / EBIT Other income/expense), net Income before provision for income taxes Provision for income taxes Net income Earnings per share: Basic (in dollars per share) Diluted (in dollars per share) Shares used in computing earnings per share: Basic (in shares) Diluted (in shares) 6,5770 322.0 -172.0 11,398.0 18,125.0 14,541.0 889.0 13,652.0 2,950.0 10,702.0 6,347.0 481.0 -340.0 11,094.0 17,582.0 14,101.0 454.0 13,647.0 2,756.0 10,891.0 2.6 2.6 2.7 2.6 4,419.0 4,453.0 4,236.0 4,254.0
Step by Step Solution
There are 3 Steps involved in it

Get step-by-step solutions from verified subject matter experts