

Question: Workshop 2: Histograms and Descriptive Statistics The tools practiced in this workshop are: Histograms Descriptive statistics . Situation: Consider that you/your group works for a

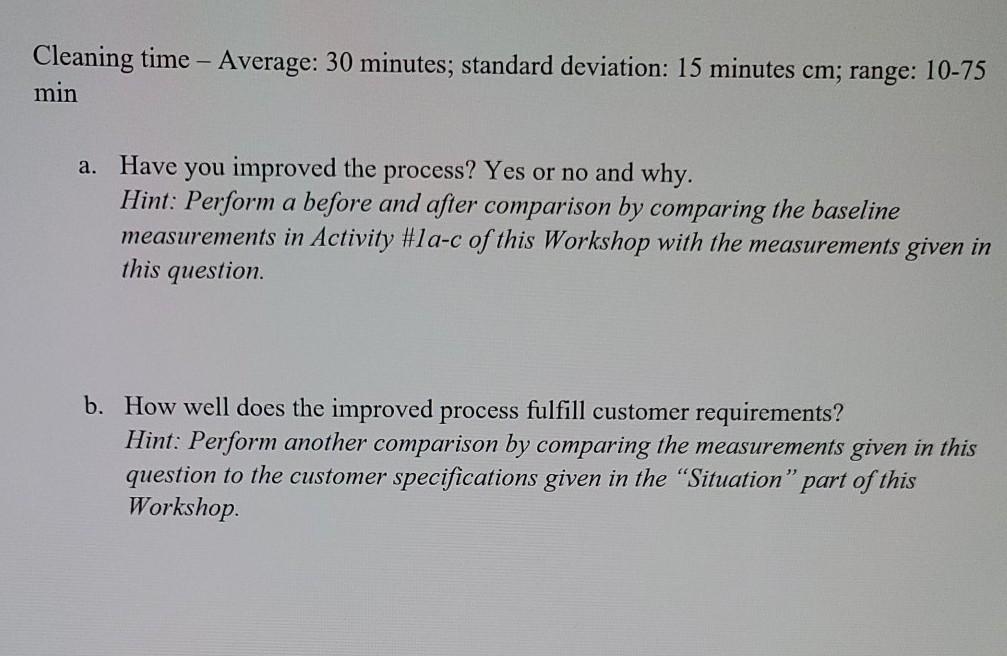

Workshop 2: Histograms and Descriptive Statistics The tools practiced in this workshop are: Histograms Descriptive statistics . Situation: Consider that you/your group works for a housekeeping company and you have been tasked with collecting data to document the current status of your cleaning performance. This data is needed to establish a baseline measurement at the beginning of your Lean Six Sigma project so that you will have a measurement to compare against later once the process has been improved. Please note that the customer specifications for your cleaning service process are: Target: 30 5 minutes (lower specification limit: 25 min and upper specification limit: 35 min) Instructions: Use information from your training manual in Measure Phase - Lessons 9-11 to assist you with the activities that follow. Be sure to follow the "best practices for each tool you use in this workshop. Your baseline data of cleaning times is provided. Use Microsoft Excel to calculate your descriptive statistics and create a histogram of your data. Activities: (also see next page) 1. For the cleaning times documented by your cleaning process, what is the: a. Average cleaning time in minutes? b. Standard deviation in minutes? c. Range in minutes? 2. Create a histogram that summarizes your data set (i.e., measurements of the cleaning times in minutes) Your histogram should have at least 10 bars: [Paste your histogram here. Please ensure your work is readable on an 8/2 in. x 11 in. piece of paper or you will not receive credit for your work.] 3. Near the end of your Lean Six Sigma project, after you have implemented solutions to improve your cleaning process, you measure the process performance again and get the following results: Cleaning time - Average: 30 minutes; standard deviation: 15 minutes cm; range: 10-75 min a. Have you improved the process? Yes or no and why. Hint: Perform a before and after comparison by comparing the baseline measurements in Activity #la-c of this Workshop with the measurements given in this question b. How well does the improved process fulfill customer requirements? Hint: Perform another comparison by comparing the measurements given in this question to the customer specifications given in the "Situation" part of this Workshop B D E F G I A Job Cleanup Time 18 20 201 201 371 55 371 20 37 29 33 33 14 100 98 20 73 14 50 25 40 120 18 44 24 1 Number 2 Job 1 3 Job 2 4. Job 3 5 Job 4 6 Job 5 7 Job 6 8 Job 7 9 Job 8 10 Job 9 11 Job 10 12 Job 11 13 Job 12 14 Job 13 15 Job 14 16 Job 15 17 Job 16 18 Job 17 19 Job 18 20 Job 19 21 Job 20 22 Job 21 23 Job 22 24 Job 23 25 Job 24 26 Job 25 27 Job 26 28 Job 27 29 Job 28 30 Job 29 31 Job 30 32 Job 31 33 Job 32 34 Job 33 35 Job 34 36 Job 35 37 Job 36 38 Job 37 39 Job 38 40 Job 39 41 Job 40 42 Job 41 43 Job 42 44 Job 43 45 Job 44 46 Job 45 47 Job 46 48 Job 47 49 Job 48 50 Job 49 51 Job 50 52 Job 51 53 Job 52 54 Job 53 55 Job 54 56 Job 55 10 106 22 15 40 50 30 58 43 20 18 28 16 20 58 32 16 35 40 16 161 18 22 22 55 31 20 15 21 55
Step by Step Solution
There are 3 Steps involved in it
1 Expert Approved Answer
Step: 1 Unlock

Question Has Been Solved by an Expert!
Get step-by-step solutions from verified subject matter experts
Step: 2 Unlock
Step: 3 Unlock