

Question: Workshop 2: Histograms and Descriptive Statistics The tools practiced in this workshop are: Histograms Descriptive statistics Situation: Consider that you/your group works for a housekeeping
Workshop 2: Histograms and Descriptive Statistics
The tools practiced in this workshop are:
- Histograms
- Descriptive statistics
Situation:
Consider that you/your group works for a housekeeping company and you have been tasked with collecting data to document the current status of your cleaning performance. This data is needed to establish a baseline measurement at the beginning of your Lean Six Sigma project so that you will have a measurement to compare against later once the process has been improved.
Please note that the customer specifications for your cleaning service process are:
Target: 30 5 minutes (lower specification limit: 25 min and upper specification limit: 35 min).
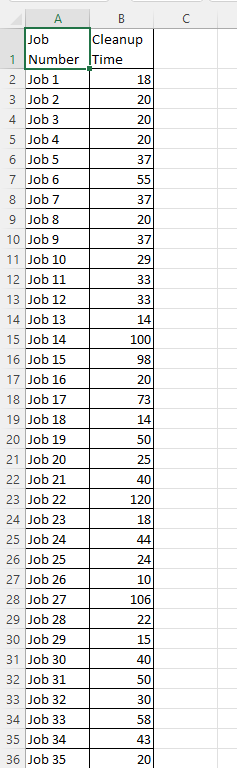
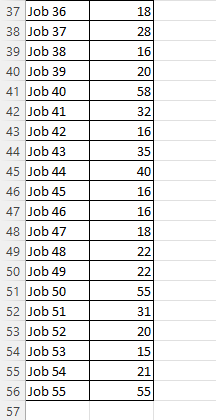
Your baseline data of cleaning times is provided. Use Microsoft Excel to calculate your descriptive statistics and create a histogram of your data.
- For the cleaning times documented by your cleaning process, what is the:
- Average cleaning time in minutes?
- Standard deviation in minutes?
- Range in minutes?
- Create a histogram that summarizes your data set (i.e., measurements of the cleaning times in minutes) Your histogram should have at least 10 bars:
- Near the end of your Lean Six Sigma project, after you have implemented solutions to improve your cleaning process, you measure the process performance again and get the following results:
Cleaning time Average: 30 minutes; standard deviation: 15 minutes cm; range: 10-75 min
- Have you improved the process? Yes or no and why.
Hint: Perform a before and after comparison by comparing the baseline measurements in Activity #1a-c of this Workshop with the measurements given in this question.
- How well does the improved process fulfill customer requirements?
Hint: Perform another comparison by comparing the measurements given in this question to the customer specifications given in the Situation part of this Workshop.
Step by Step Solution
There are 3 Steps involved in it

Get step-by-step solutions from verified subject matter experts