

Question: would u be able to answer all questions as well as verify the graph to see if it matches the information listed in the sheet.
would u be able to answer all questions as well as verify the graph to see if it matches the information listed in the sheet. the pictures are smallwhen I upload might have to zoom in on web browser or save pictures to get a better view
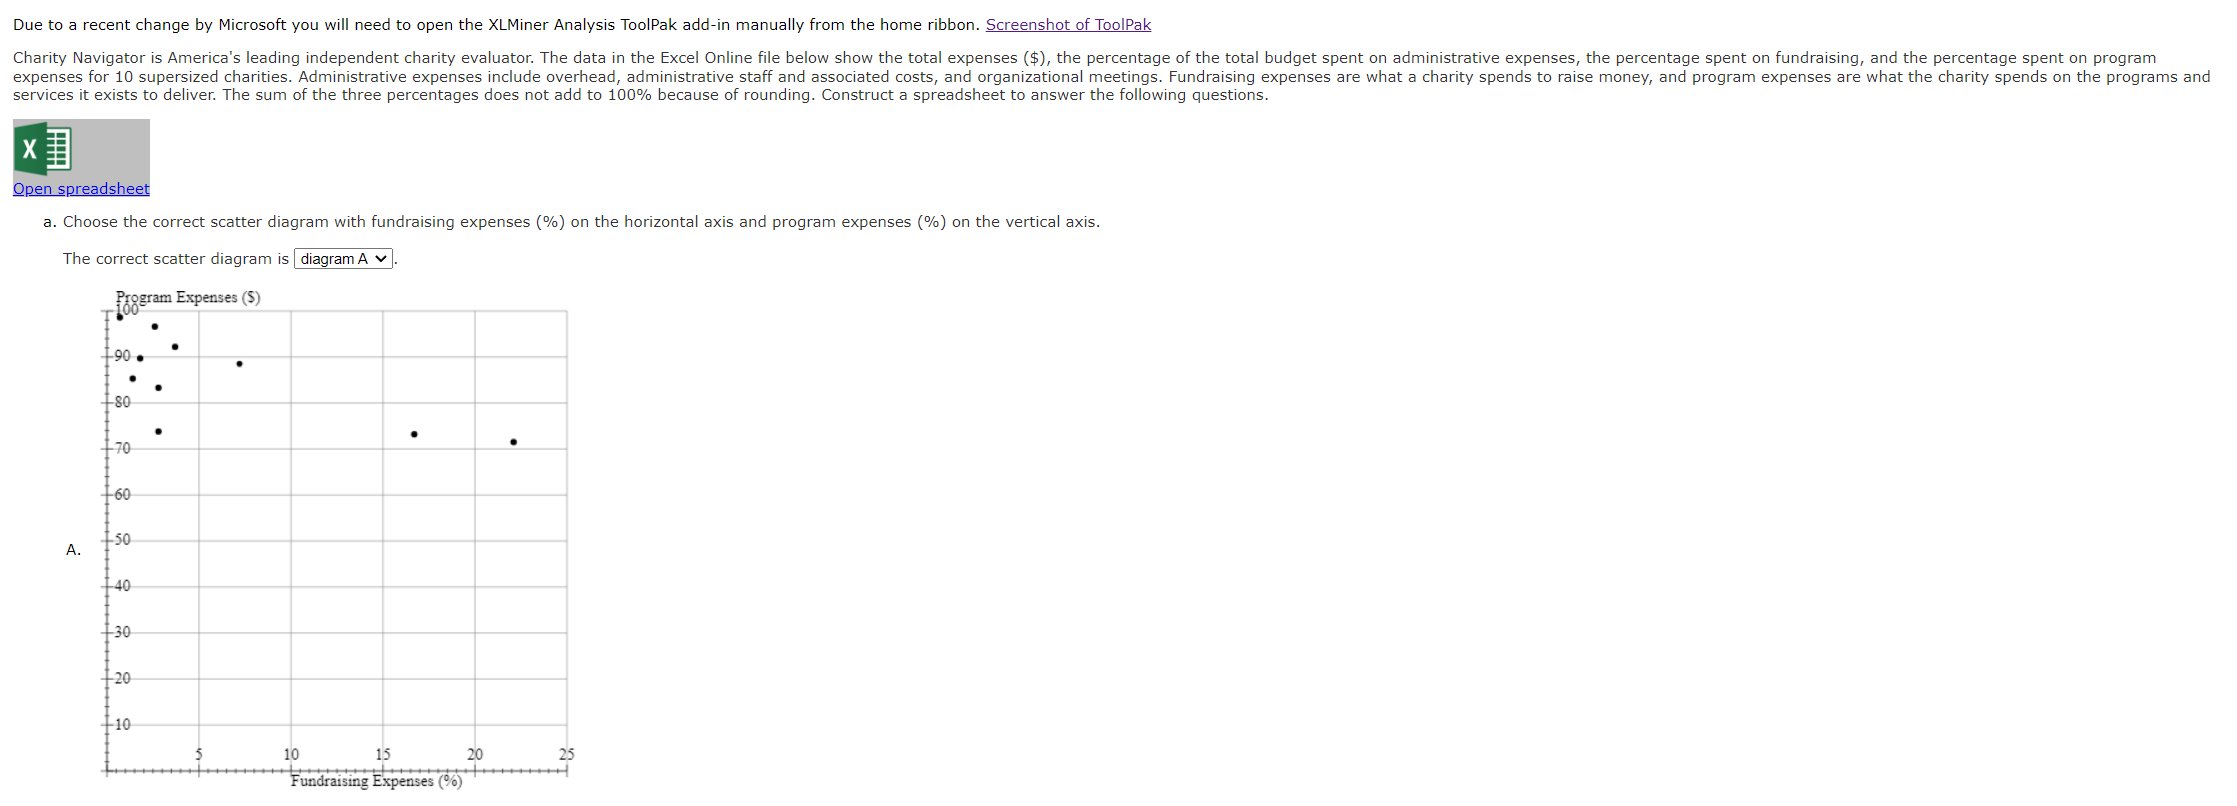
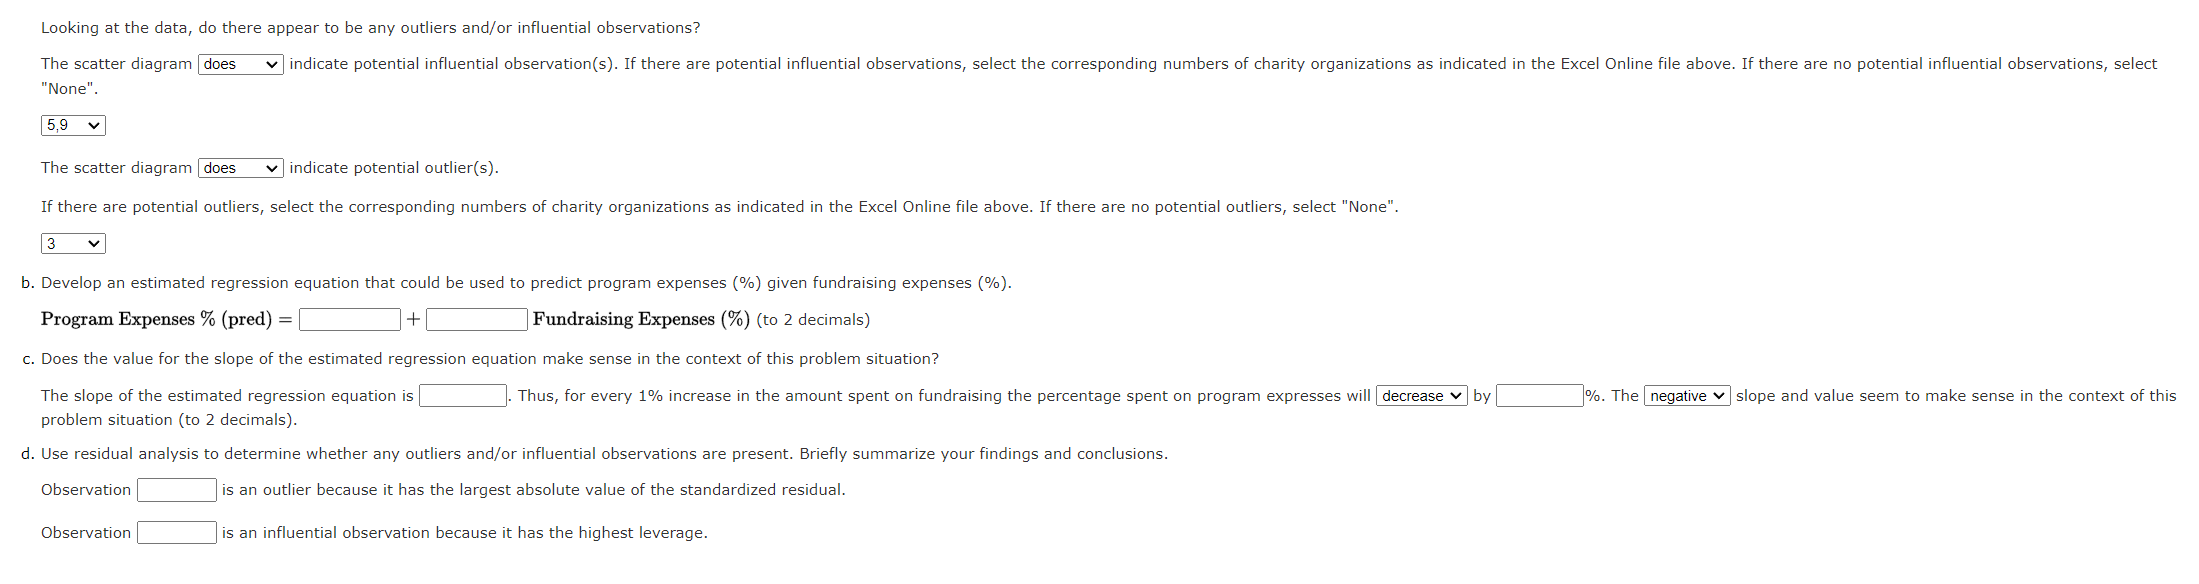
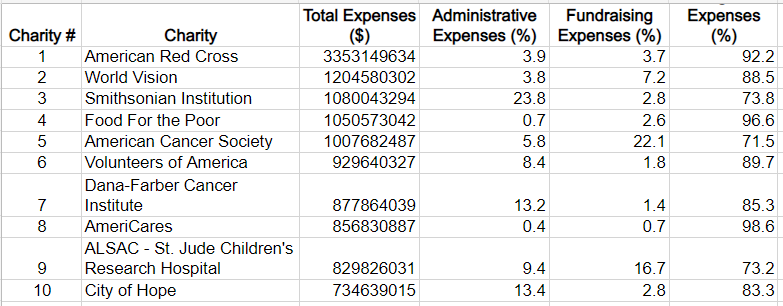
Due to a recent change by Microsoft you will need to open the XLMiner Analysis ToolPak add-in manually from the home ribbon. Screenshot of ToolPak Charity Navigator is America's leading independent charity evaluator. The data in the Excel Online file below show the total expenses ($), the percentage of the total budget spent on administrative expenses, the percentage spent on fundraising, and the percentage spent on program expenses for 10 supersized charities. Administrative expenses include overhead, administrative staff and associated costs, and organizational meetings. Fundraising expenses are what a charity spends to raise money, and program expenses are what the charity spends on the programs and services it exists to deliver. The sum of the three percentages does not add to 100% because of rounding. Construct a spreadsheet to answer the following questions. THAI Open spreadsheet a. Choose the correct scatter diagram with fundraising expenses (%) on the horizontal axis and program expenses (%) on the vertical axis. The correct scatter diagram is diagram A v 2883r rogram Expenses (5) -90. 80 70 -60 150 A. +40 8 80 20 10 25 10 15 20 Fundraising Expenses (%) Looking at the data, do there appear to be any outliers and/or influential observations? indicate potential influential observation(s). If there are potential influential observations, select the corresponding numbers of charity organizations as indicated in the Excel Online file above. If there are no potential influential observations, select The scatter diagram does "None". 5,9 The scatter diagram does vindicate potential outlier(s). If there are potential outliers, select the corresponding numbers of charity organizations as indicated in the Excel Online file above. If there are no potential outliers, select "None". 3 b. Develop an estimated regression equation that could be used to predict program expenses (%) given fundraising expenses (%). Program Expenses % (pred) = + Fundraising Expenses (%) (to 2 decimals) c. Does the value for the slope of the estimated regression equation make sense in the context of this problem situation? Thus, for every 1% increase in the amount spent on fundraising the percentage spent on program expresses will decrease by %. The negative v slope and value seem to make sense in the context of this The slope of the estimated regression equation is problem situation (to 2 decimals). d. Use residual analysis to determine whether any outliers and/or influential observations are present. Briefly summarize your findings and conclusions. Observation is an outlier because it has the largest absolute value of the standardized residual. Observation is an influential observation because it has the highest leverage. WN Charity # Charity 1 American Red Cross 2 World Vision 3 Smithsonian Institution 4 Food For the Poor 5 American Cancer Society 6 Volunteers of America Dana-Farber Cancer 7 Institute 8 AmeriCares ALSAC - St. Jude Children's 9 Research Hospital 10 City of Hope Total Expenses Administrative Fundraising ($) Expenses (%) Expenses (%) 3353149634 3.9 3.7 1204580302 3.8 7.2 1080043294 23.8 2.8 1050573042 0.7 2.6 1007682487 5.8 22.1 929640327 8.4 1.8 Expenses (%) 92.2 88.5 73.8 96.6 71.5 89.7 877864039 856830887 13.2 0.4 1.4 0.7 85.3 98.6 829826031 734639015 9.4 13.4 16.7 2.8 73.2 83.3 Due to a recent change by Microsoft you will need to open the XLMiner Analysis ToolPak add-in manually from the home ribbon. Screenshot of ToolPak Charity Navigator is America's leading independent charity evaluator. The data in the Excel Online file below show the total expenses ($), the percentage of the total budget spent on administrative expenses, the percentage spent on fundraising, and the percentage spent on program expenses for 10 supersized charities. Administrative expenses include overhead, administrative staff and associated costs, and organizational meetings. Fundraising expenses are what a charity spends to raise money, and program expenses are what the charity spends on the programs and services it exists to deliver. The sum of the three percentages does not add to 100% because of rounding. Construct a spreadsheet to answer the following questions. THAI Open spreadsheet a. Choose the correct scatter diagram with fundraising expenses (%) on the horizontal axis and program expenses (%) on the vertical axis. The correct scatter diagram is diagram A v 2883r rogram Expenses (5) -90. 80 70 -60 150 A. +40 8 80 20 10 25 10 15 20 Fundraising Expenses (%) Looking at the data, do there appear to be any outliers and/or influential observations? indicate potential influential observation(s). If there are potential influential observations, select the corresponding numbers of charity organizations as indicated in the Excel Online file above. If there are no potential influential observations, select The scatter diagram does "None". 5,9 The scatter diagram does vindicate potential outlier(s). If there are potential outliers, select the corresponding numbers of charity organizations as indicated in the Excel Online file above. If there are no potential outliers, select "None". 3 b. Develop an estimated regression equation that could be used to predict program expenses (%) given fundraising expenses (%). Program Expenses % (pred) = + Fundraising Expenses (%) (to 2 decimals) c. Does the value for the slope of the estimated regression equation make sense in the context of this problem situation? Thus, for every 1% increase in the amount spent on fundraising the percentage spent on program expresses will decrease by %. The negative v slope and value seem to make sense in the context of this The slope of the estimated regression equation is problem situation (to 2 decimals). d. Use residual analysis to determine whether any outliers and/or influential observations are present. Briefly summarize your findings and conclusions. Observation is an outlier because it has the largest absolute value of the standardized residual. Observation is an influential observation because it has the highest leverage. WN Charity # Charity 1 American Red Cross 2 World Vision 3 Smithsonian Institution 4 Food For the Poor 5 American Cancer Society 6 Volunteers of America Dana-Farber Cancer 7 Institute 8 AmeriCares ALSAC - St. Jude Children's 9 Research Hospital 10 City of Hope Total Expenses Administrative Fundraising ($) Expenses (%) Expenses (%) 3353149634 3.9 3.7 1204580302 3.8 7.2 1080043294 23.8 2.8 1050573042 0.7 2.6 1007682487 5.8 22.1 929640327 8.4 1.8 Expenses (%) 92.2 88.5 73.8 96.6 71.5 89.7 877864039 856830887 13.2 0.4 1.4 0.7 85.3 98.6 829826031 734639015 9.4 13.4 16.7 2.8 73.2 83.3Step by Step Solution
There are 3 Steps involved in it
1 Expert Approved Answer
Step: 1 Unlock

Question Has Been Solved by an Expert!
Get step-by-step solutions from verified subject matter experts
Step: 2 Unlock
Step: 3 Unlock