

Question: would you please answer question # 3 & 4 in both Excel & Words formats with all details? Matt Kenseth won the 2012 Daytona 500,
would you please answer question # 3 & 4 in both Excel & Words formats with all details? 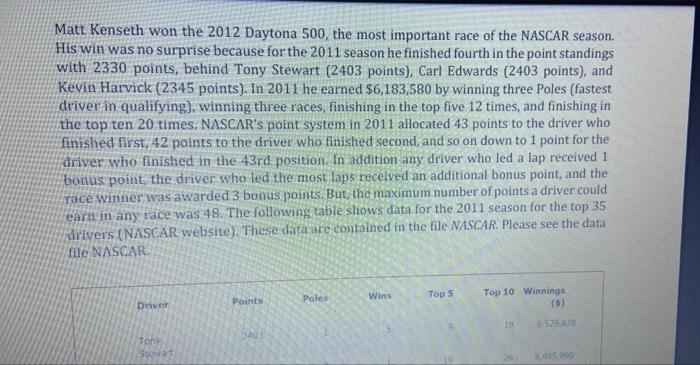
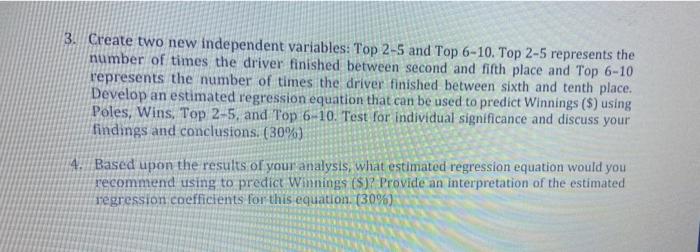
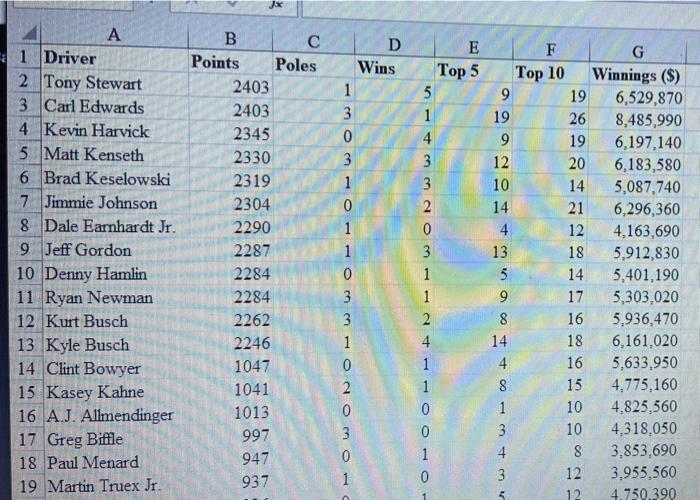
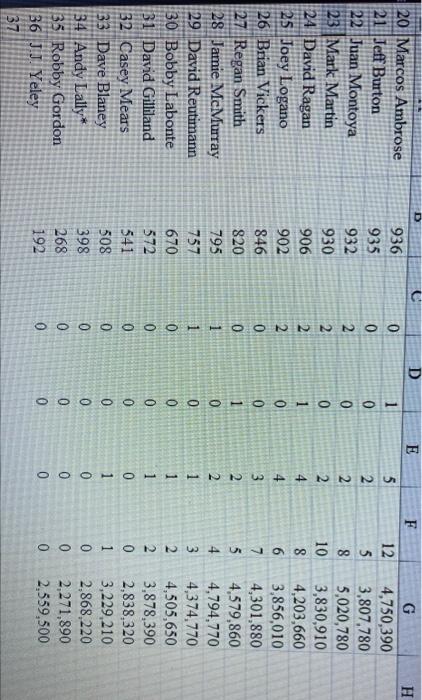
Matt Kenseth won the 2012 Daytona 500, the most important race of the NASCAR season. His win was no surprise because for the 2011 season he finished fourth in the point standings with 2330 points, behind Tony Stewart (2403 points), Carl Edwards (2403 points), and Kevin Harvick (2345 points). In 2011 he earned $6,183,580 by winning three Poles (fastest driver in qualifying). winning three races, finishing in the top five 12 times, and finishing in the top ten 20 times. NASCAR's point system in 2011 allocated 43 points to the driver who finished first, 42 points to the driver who finished second, and so on down to 1 point for the driver who finished in the 43rd position. In addition any driver who led a lap received 1 bonus point, the driver who led the most laps received an additional bonus point, and the race winner was awarded 3 bonus points. But, the maximum number of points a driver could earn in any race was 48. The following table shows data for the 2011 season for the top 35 drivers (NASCAR website). These data are contained in the file NASCAR. Please see the data file NASCAR Poles Wins Top 5 Points Top 10 Winnings Driver 5.529. HAU Tony Swat H000 3. Create two new independent variables: Top 2-5 and Top 6-10. Top 2-5 represents the number of times the driver finished between second and fifth place and Top 6-10 represents the number of times the driver finished between sixth and tenth place. Develop an estimated regression equation that can be used to predict Winnings ($) using Poles, Wins, Top 2-5, and Top 6-10. Test for individual significance and discuss your findings and conclusions. (30%) 4. Based upon the results of your analysis, what estimated regression equation would you recommend using to predict Winnings (s)? Provide an interpretation of the estimated regression coefficients for this equation. (30%) Jax D Wins 1 3 0 3 1 1 Driver 2 Tony Stewart 3 Carl Edwards 4 Kevin Harvick 5 Matt Kenseth 6 Brad Keselowski 7 Jimmie Johnson 8 Dale Earnhardt Jr. 9 Jeff Gordon 10 Denny Hamlin 11 Ryan Newman 12 Kurt Busch 13 Kyle Busch 14 Clint Bowyer 15 Kasey Kahne 16 A.J. Allmendinger 17 Greg Biffle 18 Paul Menard 19 Martin Truex Jr. B Points Poles 2403 2403 2345 2330 2319 2304 2290 2287 2284 2284 2262 2246 1047 1041 1013 997 947 937 E Top 5 5 1 4 3 3 2 0 3 1 1 2 4 1 1 0 0 1 0 OOOOO F G Top 10 Winnings ($) 9 19 6,529,870 19 26 8,485,990 9 19 6,197,140 12 20 6,183,580 10 14 5,087,740 14 21 6,296,360 4 12 4,163,690 13 18 5,912,830 5 14 5,401,190 9 17 5,303,020 8 16 5,936,470 14 18 6,161,020 4 16 5,633,950 8 15 4,775,160 1 10 4,825,560 3 10 4,318,050 4 8 3,853,690 3 12 3,955,560 5 12 4.750.390 3 3 2 3 1 D E F H Oo 20 Marcos Ambrose 21 Jeff Burton 22 Juan Montoya 23 Mark Martin 24 David Ragan 25. Joey Logano 26 Brian Vickers 27 Regan Smith 28 Jamie McMurray 29 David Reutimann 30 Bobby Labonte 31 David Gilliland 32 Casey Mears 33 Dave Blaney 34 Andy Lally* 35 Robby Gordon 36 JJ, Yeley 936 935 932 930 906 902 846 820 795 757 670 572 541 508 398 268 192 0 0 2 2 2 2 0 0 1 1 0 0 1 0 0 0 1 0 0 1 0 0 0 0 0 5 2 2 2 4 4 3 2 2 1 1 1 0 1 0 0 12 5 8 10 8 6 7 5 4 3 2 2 0 1 0 0 0 G 4,750,390 3,807.780 5,020,780 3,830,910 4,203,660 3,856,010 4,301,880 4,579,860 4,794,770 4,374,770 4,505,650 3,878,390 2,838,320 3,229,210 2.868,220 2,271,890 2,559,500 0 0 0 0 0 0 OOO 0 37 Step by Step Solution
There are 3 Steps involved in it
1 Expert Approved Answer
Step: 1 Unlock

Question Has Been Solved by an Expert!
Get step-by-step solutions from verified subject matter experts
Step: 2 Unlock
Step: 3 Unlock