

Question: Would you please provide me with a step by step solution to solving this problem? Can you also show me how to d o it
Would you please provide me with a step by step solution to solving this problem? Can you also show me how to do it step by step in Excel? I am not good at Excel. Thank you so much in advance for all your help!
Data: Watson Electric Company Data.xlsx
- What is the upper control limit (UCL) for the X-bar control chart? (Please enter your answer rounded to 2 decimal places e.g. 12.89)
- What is the lower control limit (LCL) for the X-bar control chart? Enter your answer rounded to 2 decimal places.
(The required data file can be found in the first Watson Electric Company question).
- What is the upper control limit (UCL) for the R control chart? Enter your answer rounded to 2 decimal places.
(The required data file can be found in the first Watson Electric Company question).
- What is the lower control limit (LCL) for the R control chart? Enter your answer rounded to 2 decimal places.
(The required data file can be found in the first Watson Electric Company question).
5. After control charts have been established, a new sample is taken. The sample obtained had the following readings: 625, 592, 612, and 635. Comparing this sample with the control charts, what can we say about the process based on this recent sample? Select all options that are correct.
(The required data file can be found in the first Watson Electric Company question).
1. The process is not in control.
2. The sample exceeds the control limits on the X-bar chart.
3. The sample exceeds the control limits on the R chart.
4. The process is in control.
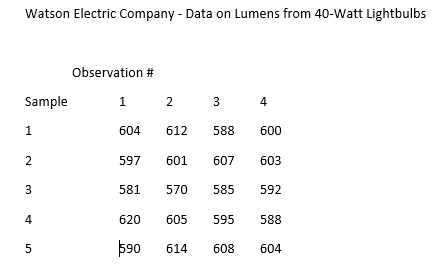
Watson Electric Company - Data on Lumens from 40-Watt Lightbulbs Observation # Sample 1 2 3 4 1 604 612 588 600 2 597 601 607 603 3 581 570 585 592 4 620 605 595 588 5 $90 614 608 604Step by Step Solution
There are 3 Steps involved in it

Get step-by-step solutions from verified subject matter experts