

Question: Table below indicates the duration of and labour requirement for each activity of a small project. Duration (Weeks) Gang Size 10 Activity 1-2 2
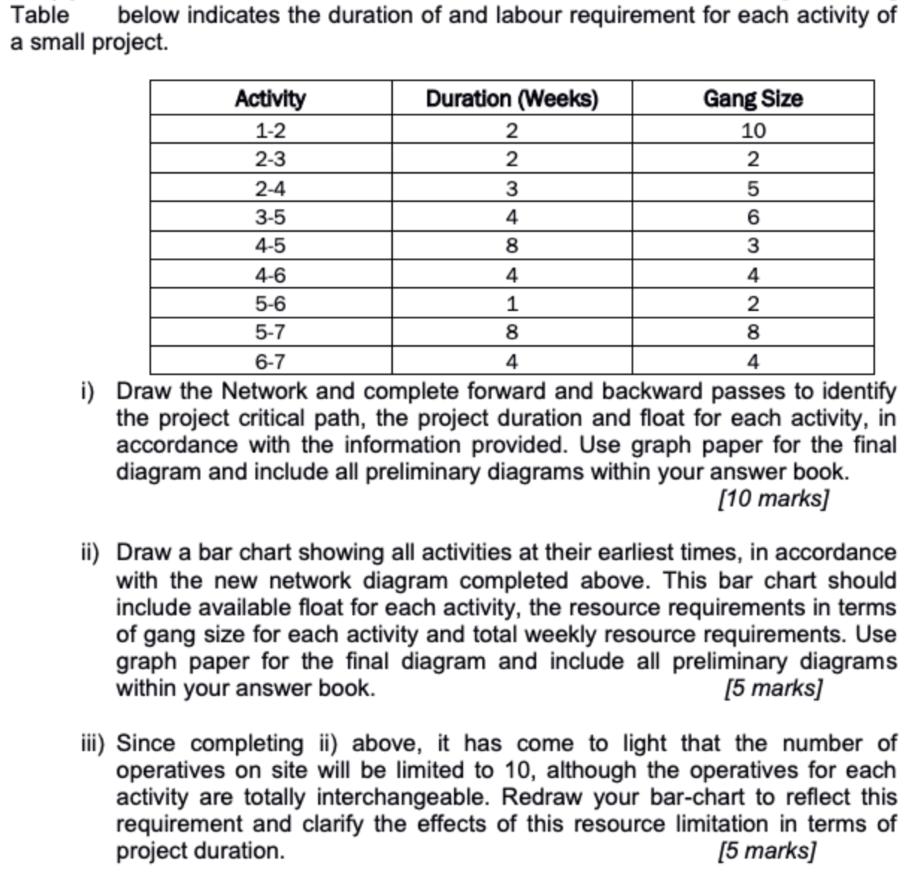
Table below indicates the duration of and labour requirement for each activity of a small project. Duration (Weeks) Gang Size 10 Activity 1-2 2 2-3 2-4 2 3 2 3-5 4 4-5 8 563 4-6 4 4 5-6 1 2 5-7 8 8 6-7 4 4 i) Draw the Network and complete forward and backward passes to identify the project critical path, the project duration and float for each activity, in accordance with the information provided. Use graph paper for the final diagram and include all preliminary diagrams within your answer book. [10 marks] ii) Draw a bar chart showing all activities at their earliest times, in accordance with the new network diagram completed above. This bar chart should include available float for each activity, the resource requirements in terms of gang size for each activity and total weekly resource requirements. Use graph paper for the final diagram and include all preliminary diagrams within your answer book. [5 marks] iii) Since completing ii) above, it has come to light that the number of operatives on site will be limited to 10, although the operatives for each activity are totally interchangeable. Redraw your bar-chart to reflect this requirement and clarify the effects of this resource limitation in terms of project duration. [5 marks]
Step by Step Solution
3.41 Rating (145 Votes )
There are 3 Steps involved in it
draw the network diagram for the project activity duration 12 2 23 2 24 3 35 4 45 8 46 4 56 1 57 8 67 4 By using forward passes for an event 12 ES 0 E... View full answer

Get step-by-step solutions from verified subject matter experts