

Question: Write a function that decides a suitable number format based on the data. ( 1 5 % ) - In the parameter list, it
Write a function that decides a suitable number format based on the data.
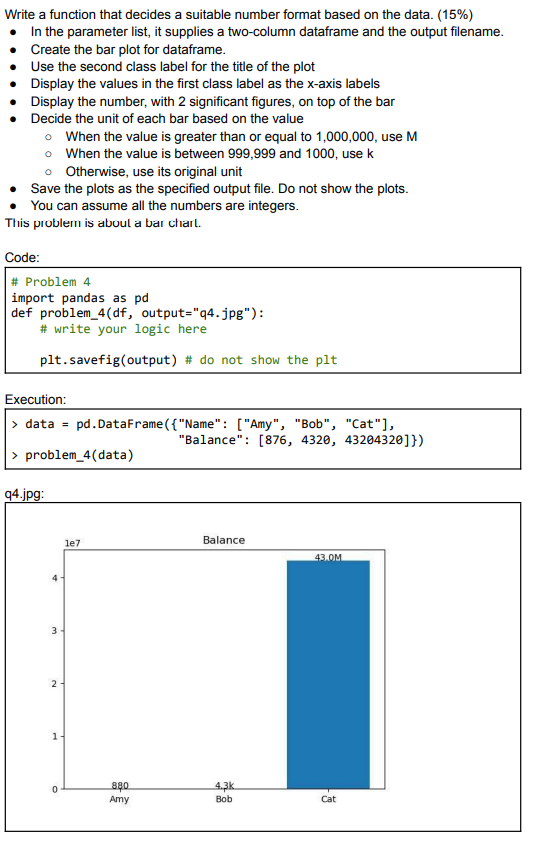
In the parameter list, it supplies a twocolumn dataframe and the output filename.
Create the bar plot for dataframe.
Use the second class label for the title of the plot
Display the values in the first class label as the xaxis labels
Display the number, with significant figures, on top of the bar
Decide the unit of each bar based on the value
When the value is greater than or equal to use M
When the value is between and use k
Otherwise, use its original unit
Save the plots as the specified output file. Do not show the plots.
You can assume all the numbers are integers.
This problem is aboul a bar chart.
Code:
# Problem
import pandas as pd
def problemdf outputqjpg:
# write your logic here
pltsavefigoutput # do not show the plt
Execution:
data pdDataFrameName: Amy "Bob", "Cat"
"Balance":
problemdata
qjpg:
Step by Step Solution
There are 3 Steps involved in it
1 Expert Approved Answer
Step: 1 Unlock

Question Has Been Solved by an Expert!
Get step-by-step solutions from verified subject matter experts
Step: 2 Unlock
Step: 3 Unlock