

Question: Write a MATLAB function named fun3initials() that accepts as input arguments a vector x (f) and two scalars, m and s, and plots the function
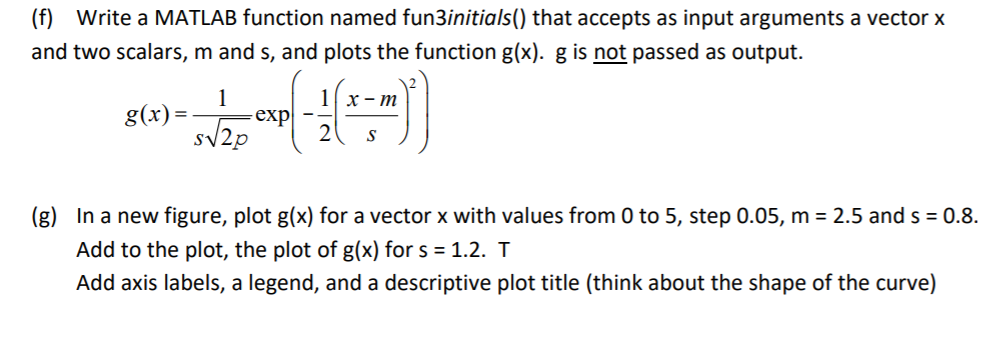
Write a MATLAB function named fun3initials() that accepts as input arguments a vector x (f) and two scalars, m and s, and plots the function g(x). g is not passed as output. - g(x) = exp 2 sV2p In a new figure, plot g(x) for a vector x with values from 0 to 5, step 0.05, m = 2.5 and s = 0.8. (g) Add to the plot, the plot of g(x) for s = 1.2. T Add axis labels, a legend, and a descriptive plot title (think about the shape of the curve)
Step by Step Solution
There are 3 Steps involved in it
1 Expert Approved Answer
Step: 1 Unlock

Question Has Been Solved by an Expert!
Get step-by-step solutions from verified subject matter experts
Step: 2 Unlock
Step: 3 Unlock