

Question: Write a Matlab function that will receive x and y vectors representing data points. Write a function called myfit(x,y) that will receive x and y
Write a Matlab function that will receive x and y vectors representing data points.
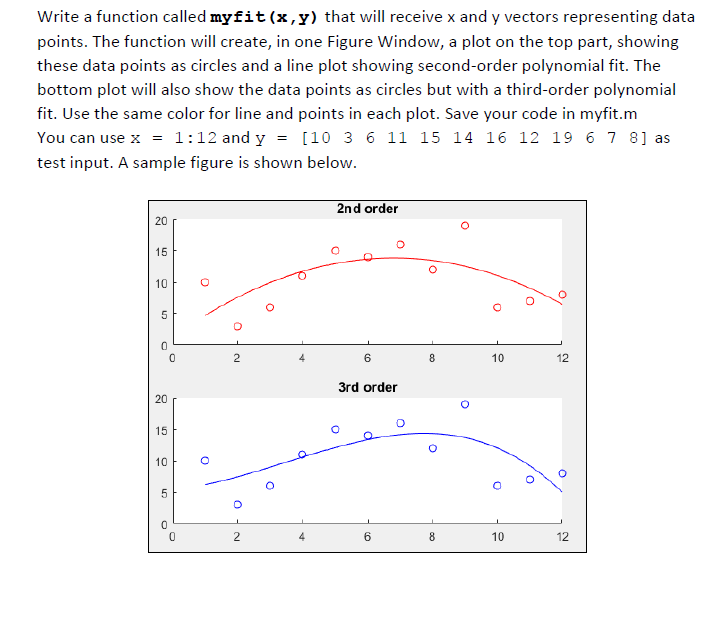
Write a function called myfit(x,y) that will receive x and y vectors representing data points. The function will create, in one Figure Window, a plot on the top part, showing these data points as circles and a line plot showing second-order polynomial fit. The bottom plot will also show the data points as circles but with a third-order polynomial fit. Use the same color for line and points in each plot. Save your code in myfit.m You can use x1:12 and y[10 3 6 11 15 14 16 12 196 7 81 as test input. A sample figure is shown below 2nd order 20 10 6 10 3rd order 20 15 10 6 10 12
Step by Step Solution
There are 3 Steps involved in it

Get step-by-step solutions from verified subject matter experts