

Question: Write a MATLAB script that plots the function atan(x) for the values of x from -10 to 10 inclusive. Label the axes and title the
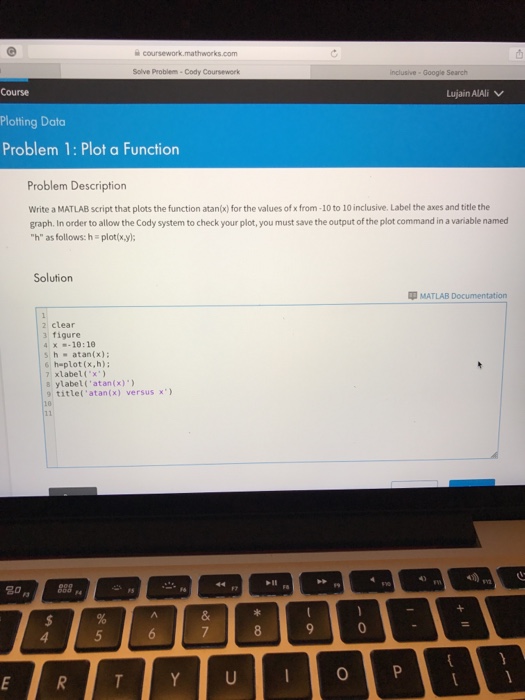
Write a MATLAB script that plots the function atan(x) for the values of x from -10 to 10 inclusive. Label the axes and title the graph. In order to allow the Cody system to check your plot, you must save the output of the plot command in a variable named "h" as follows: h = plot(x, y); clear figure x = -10:10 h = atan(x); h=plot(x, h); xlabel('x') ylabel('atan(x)') title('atan(x) versus x')
Step by Step Solution
There are 3 Steps involved in it
1 Expert Approved Answer
Step: 1 Unlock

Question Has Been Solved by an Expert!
Get step-by-step solutions from verified subject matter experts
Step: 2 Unlock
Step: 3 Unlock