

Question: Write a MATLAB script that will produce the exact same plot as Figure 6 (including labels, legend, sampling interval, line style, etc.). You can find
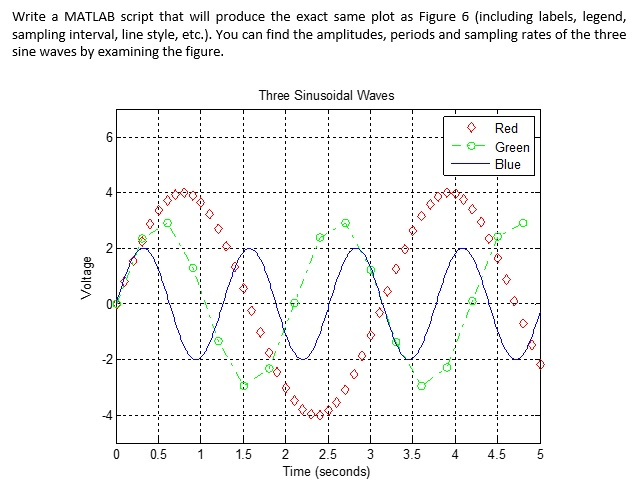
Write a MATLAB script that will produce the exact same plot as Figure 6 (including labels, legend, sampling interval, line style, etc.). You can find the amplitudes, periods and sampling rates of the three sine waves by examining the figure
Step by Step Solution
There are 3 Steps involved in it
1 Expert Approved Answer
Step: 1 Unlock

Question Has Been Solved by an Expert!
Get step-by-step solutions from verified subject matter experts
Step: 2 Unlock
Step: 3 Unlock