

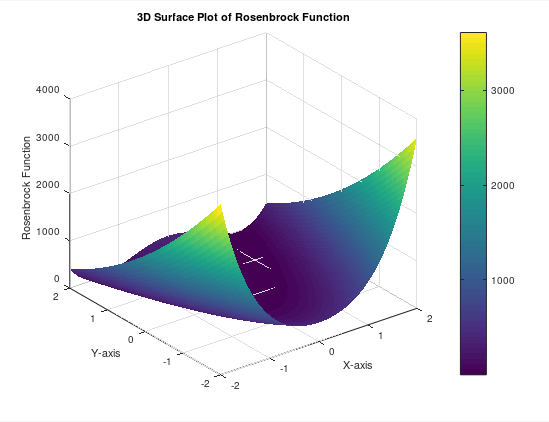
Question: Write a MATLAB script to visualize a 3 D surface plot of the Rosenbrock function, also known as the banana function or the valley function.
Write a MATLAB script to visualize a D surface plot of the Rosenbrock function, also known as the "banana function" or the "valley function." The Rosenbrock function is defined as:
fxyaxbyx
where a and b are constants. Generate a D surface plot of the Rosenbrock function for x and y values in the range and use a and b Include labels for the axes and a title for the plot.
Step by Step Solution
There are 3 Steps involved in it
1 Expert Approved Answer
Step: 1 Unlock

Question Has Been Solved by an Expert!
Get step-by-step solutions from verified subject matter experts
Step: 2 Unlock
Step: 3 Unlock