

Question: Write a program in C++ that computes and displays the maximum, minimum, mean, and standard deviation of the observations stored in the array given as
Write a program in C++ that computes and displays the maximum, minimum, mean, and standard deviation of the observations stored in the array given as input by the user. Additionally, all data values or observations which are more or less than one standard deviation from the computed mean should be dropped and the new resulting array along with its max, min, mean, and std. dev. values should be computed and displayed.
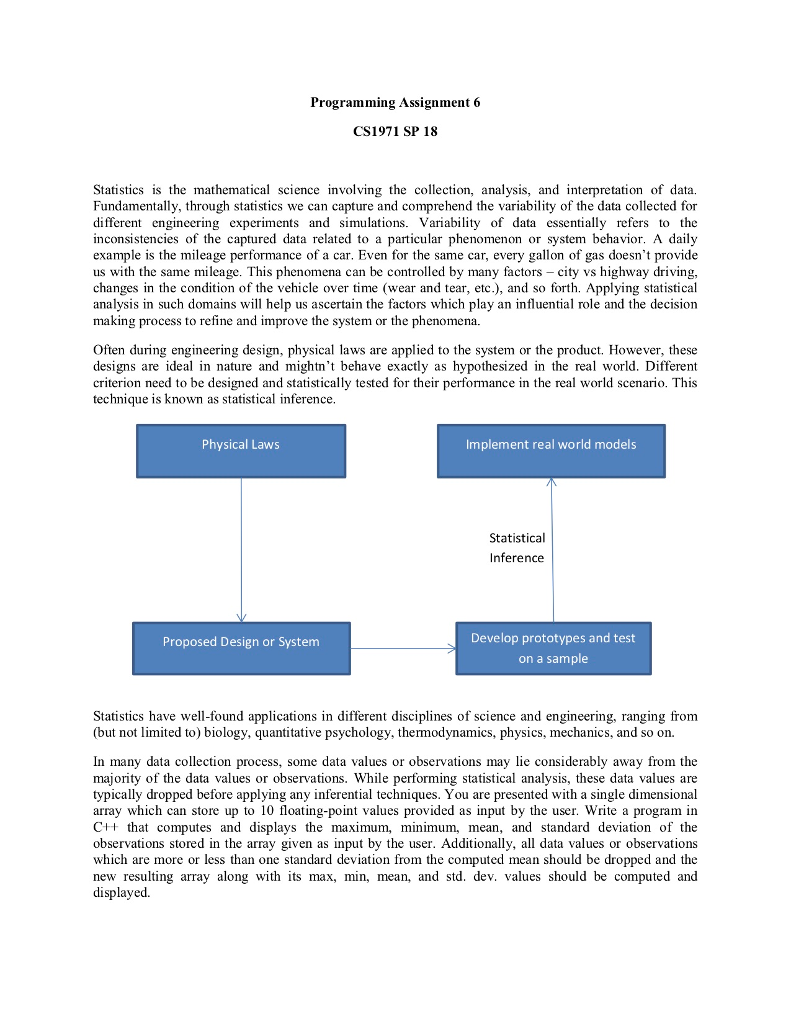
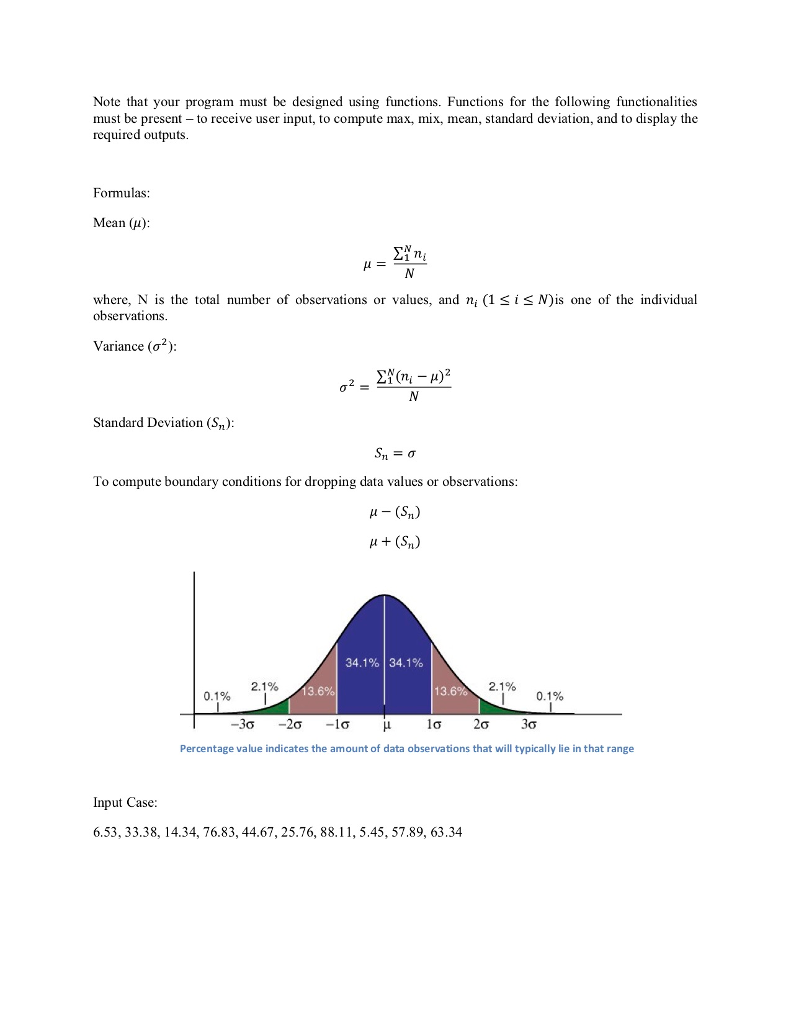
Programming Assignment 6 CS1971 SP 18 Statistics is the mathematical science involving the collection, analysis, and interpretation of data. Fundamentally, through statistics we can capture and comprehend the variability of the data collected for different engineering experiments and simulations. Variability of data essentially refers to the inconsistencies of the captured data related to a particular phenomenon or system behavior. A daily example is the mileage performance of a car. Even for the same car, every gallon of gas doesn't provide us with the same mileage. This phenomena can be controlled by many factors city vs highway driving changes in the condition of the vehicle over time (wear and tear, etc.), and so forth. Applying statistical analysis in such domains will help us ascertain the factors which play an influential role and the decision making process to refine and improve the system or the phenomena. Often during engineering design, physical laws are applied to the system or the product. However, these designs are ideal in nature and mightn't behave exactly as hypothesized in the real world. Different criterion need to be designed and statistically tested for their performance in the real world scenario. This technique is known as statistical inference Physical Laws Implement real world models Statistical Inference Develop prototypes and test on a sample Proposed Design or System Statistics have well-found applications in different disciplines of science and engineering, ranging from (but not limited to) biology, quantitative psychology, thermodynamics, physics, mechanics, and so on. In many data collection process, some data values or observations may lie considerably away from the majority of the data values or observations. While performing statistical analysis, these data values are typically dropped before applying any inferential techniques. You are presented with a single dimensional array which can store up to 10 floating-point values provided as input by the user. Write a program in C++ that computes and displays the maximum, minimum, mean, and standard deviation of the observations stored in the array given as input by the user. Additionally, all data values or observations which are more or less than one standard deviation from the computed mean should be dropped and the new resulting array along with its max, min, mean, and std. dev. values should be computed and displayed
Step by Step Solution
There are 3 Steps involved in it

Get step-by-step solutions from verified subject matter experts