

Question: Write a script that makes a line plot of sinc function sin(Ttx) y(x) = sinc(ix) = = from x -10 to 10. Use eps to
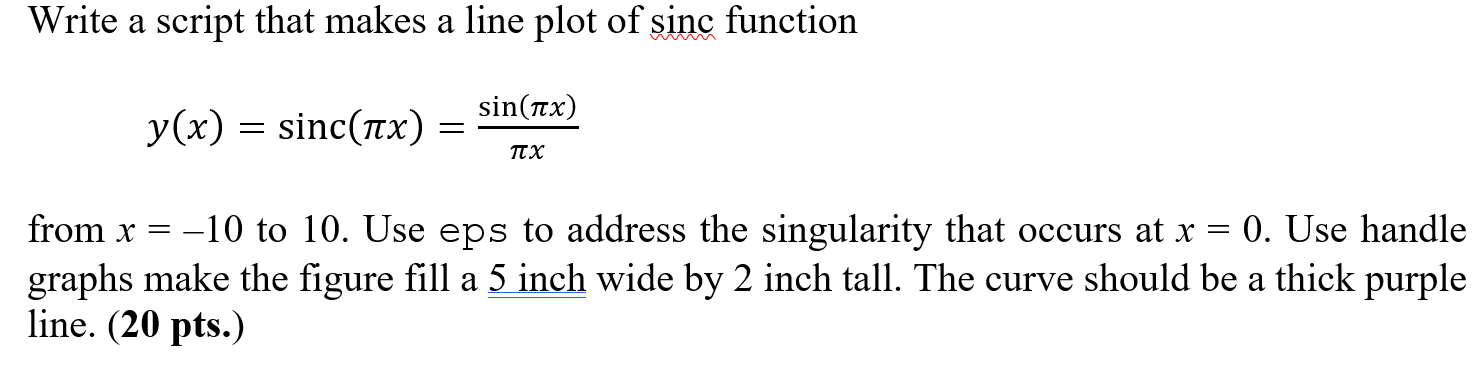
Write a script that makes a line plot of sinc function sin(Ttx) y(x) = sinc(ix) = = from x -10 to 10. Use eps to address the singularity that occurs at x = 0. Use handle graphs make the figure fill a 5 inch wide by 2 inch tall. The curve should be a thick purple line. (20 pts.)
Step by Step Solution
There are 3 Steps involved in it
1 Expert Approved Answer
Step: 1 Unlock

Question Has Been Solved by an Expert!
Get step-by-step solutions from verified subject matter experts
Step: 2 Unlock
Step: 3 Unlock