

Question: Write code in python to create graphs that answer parts A through D below using the data in the table below. For each of the
Write code in python to create graphs that answer parts A through D below using the data in the table below.
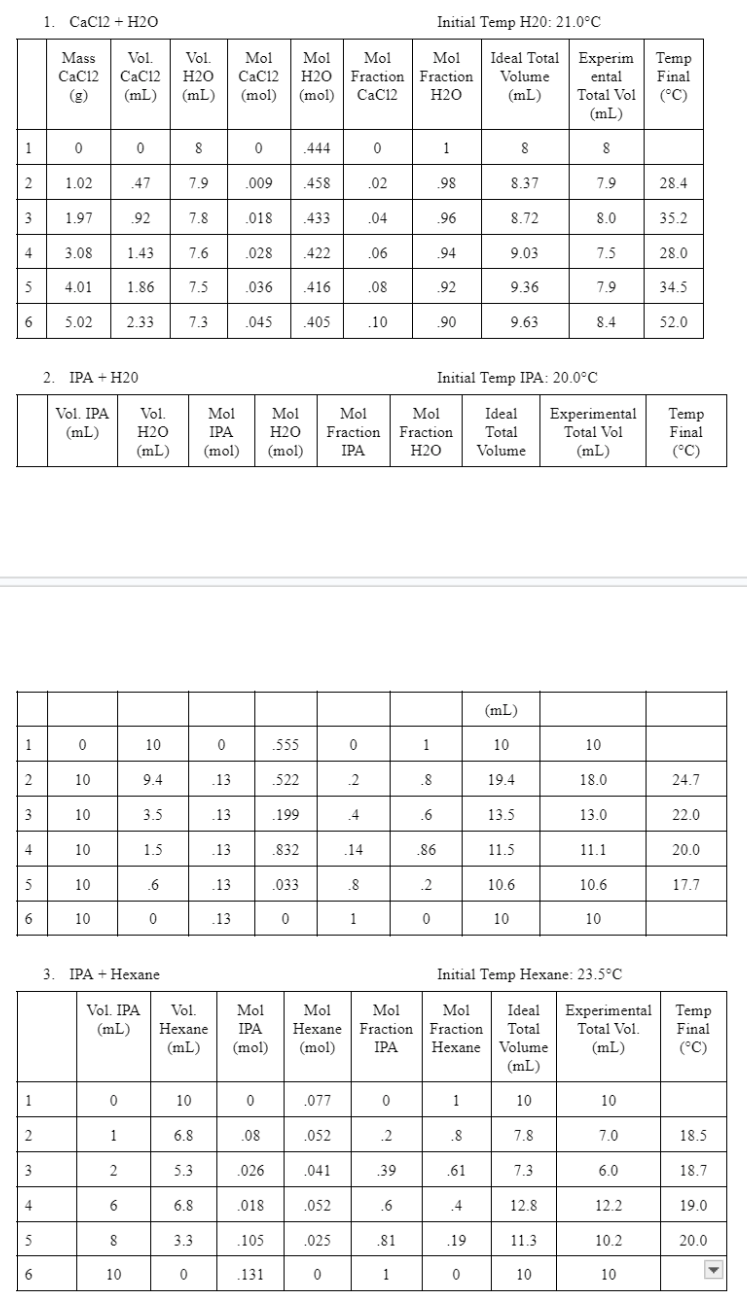
For each of the three mixtures, provide plots of the following:
a Ideal molar volume vs mole fraction of substance added
b Actual molar volume vs mole fraction of substance added
c Excess molar volume vs mole fraction of substance added
d Partial molar volume vs mole fraction of substance added
For each mixture, the ideal a actual b and excess c molar volume plots should be on the same graph for each mixture. This means that you will have three graph, each containing three sets of data.
Plot d on a separate graph for each mixture. You will have two curves for each graph eg for the IPAHexane mixture, you will have both the IPA and Hexane partial molar volumes plotted vs the mole fraction of IPA Hint: To plot the partial molar volumes, you need to find the slope of the ideal molar volume.
Step by Step Solution
There are 3 Steps involved in it
1 Expert Approved Answer
Step: 1 Unlock

Question Has Been Solved by an Expert!
Get step-by-step solutions from verified subject matter experts
Step: 2 Unlock
Step: 3 Unlock