

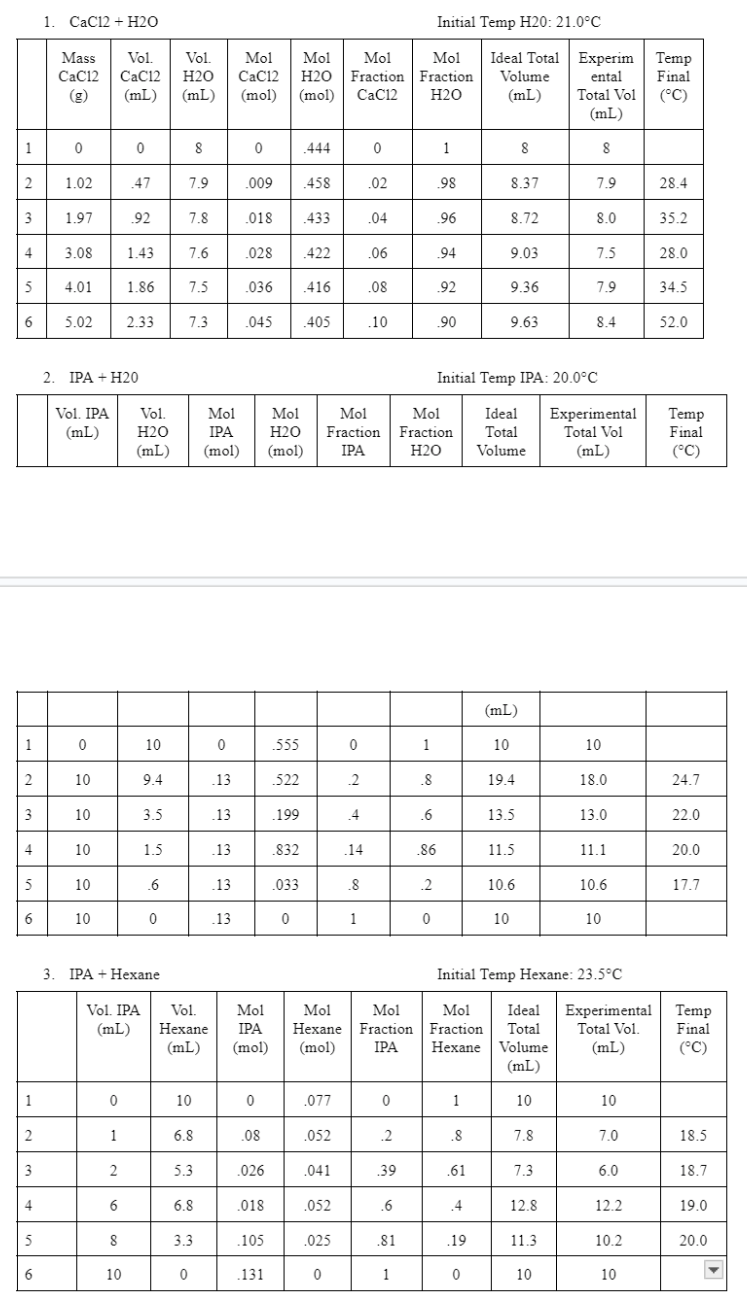
Question: Write code in python to create graphs that answers part D below using the data in the table below. I have also included my code
Write code in python to create graphs that answers part D below using the data in the table below. I have also included my code for ideal molar volume vs mole fraction of substance added below.
For each of the three mixtures, provide plots of the following:
d Partial molar volume vs mole fraction of substance added
Plot d on a separate graph for each mixture. You will have two curves for each graph eg for the IPAHexane mixture, you will have both the IPA and Hexane partial molar volumes plotted vs the mole fraction of IPA Hint: To plot the partial molar volumes, you need to find the slope of the ideal molar volume.
import numpy as np
import matplotlib.pyplot as plt
# Data for the mixtures
mixturesdata
'Mixture : x: nparray
Videal': nparray
'Mixture : x: nparray
Videal': nparray
'Mixture : x: nparray
Videal': nparray
# Plotting ideal molar volumes for each mixture
for mixture, data in mixturesdata.items:
pltfigurefigsize
# Plot ideal molar volume
pltplotdatax dataVideal' label'Ideal Molar Volume', markero
pltxlabelMole Fraction of Substance Added'
pltylabelMolar Volume cmmol
plttitlefMixture mixture: Ideal, Actual, and Excess Molar Volumes'
pltlegend
pltgridTrue
pltshow
Step by Step Solution
There are 3 Steps involved in it
1 Expert Approved Answer
Step: 1 Unlock

Question Has Been Solved by an Expert!
Get step-by-step solutions from verified subject matter experts
Step: 2 Unlock
Step: 3 Unlock