

Question: Write excel functions to calculate MAD, MSE, and MAPE by using the inputs of actual and forecast. Please put the functions in a chart similar
Write excel functions to calculate MAD, MSE, and MAPE by using the inputs of actual and forecast. Please put the functions in a chart similar to mine.
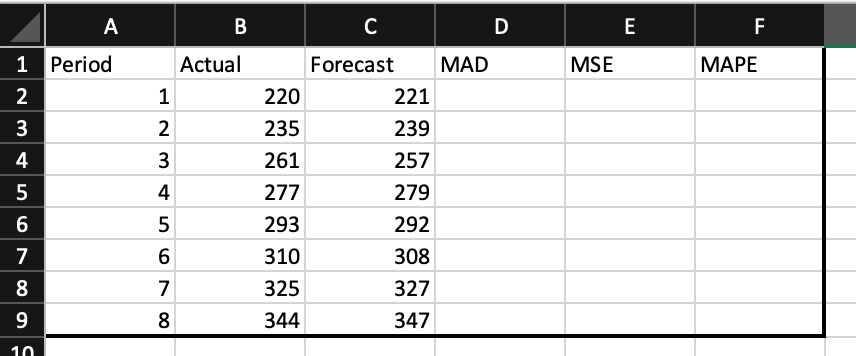
\begin{tabular}{|r|r|r|r|r|r|r|r|} \hline & \multicolumn{1}{|c|}{ A } & \multicolumn{1}{|c|}{ B } & \multicolumn{1}{c|}{ C } & D & \multicolumn{1}{c|}{ E } & F \\ \hline 1 & Period & Actual & Forecast & MAD & MSE & MAPE \\ \hline 2 & 1 & 220 & 221 & & & \\ \hline 3 & 2 & 235 & 239 & & & \\ \hline 4 & 3 & 261 & 257 & & & \\ \hline 5 & 4 & 277 & 279 & & & \\ \hline 6 & 5 & 293 & 292 & & \\ \hline 7 & 6 & 310 & 308 & & \\ \hline 8 & 7 & 325 & 327 & & & \\ \hline 9 & 8 & 344 & 347 & & & \\ \hline \end{tabular}
Step by Step Solution
There are 3 Steps involved in it

Get step-by-step solutions from verified subject matter experts