

Question: write Matlab code to plot the three response signals y_{pluse 1}(t), y_{pluse2}(t), and y_{pluse3}(t) in Fig. 2-7 (a), Fig. 2-7 (b), and Fig. 2-7 (c)

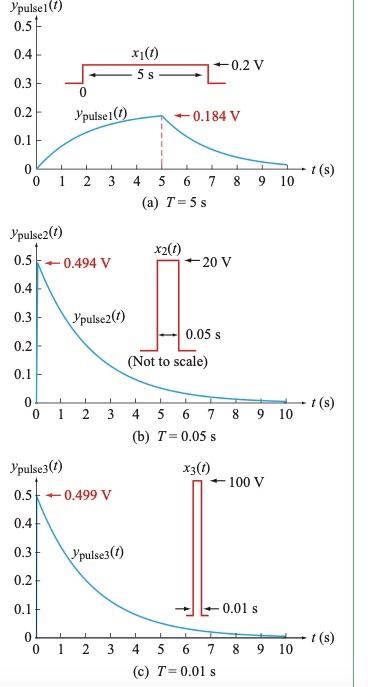
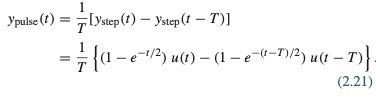
write Matlab code to plot the three response signals y_{pluse 1}(t), y_{pluse2}(t), and y_{pluse3}(t) in Fig. 2-7 (a), Fig. 2-7 (b), and Fig. 2-7 (c) pulsel (1) 0.51 0.4 0.2 V 0.3 x1(0) 5 s 0 pulsel() 0.2 +0.184 V 0.1 1 1 0 0 1 (s) 1 2 3 4 5 6 7 8 9 10 (a) T= 5s "pulse2(1) 0.5 -0.494 V 0.4 x2) +20 V 0.3 0.2 Ypulse2(1) 0.05 s (Not to scale) 0.1 1 1 0 0 (s) 2 2 3 9 10 5 6 7 8 (b) T = 0.05 s "pulse3(1) 0.5 +0.499 V x36) +100 V 0.4 0.3 pulse3() 0.2 0.1 0.01 s 1 1 0 0 1 1 t(s) 2 3 8 9 10 4 5 6 7 (c) T=0.01 s Ypulse (t) = lystep (1) - Ystep (t T)] = ; {a-e-1/2) u(1) (1 e-6-1)/2) u(1 t)} (2.21)
Step by Step Solution
There are 3 Steps involved in it
1 Expert Approved Answer
Step: 1 Unlock

Question Has Been Solved by an Expert!
Get step-by-step solutions from verified subject matter experts
Step: 2 Unlock
Step: 3 Unlock