

Question: Write MATLAB program for the following plots a ) Write a MATLAB script to create a bar plot to represent the following data about sales
Write MATLAB program for the following plots
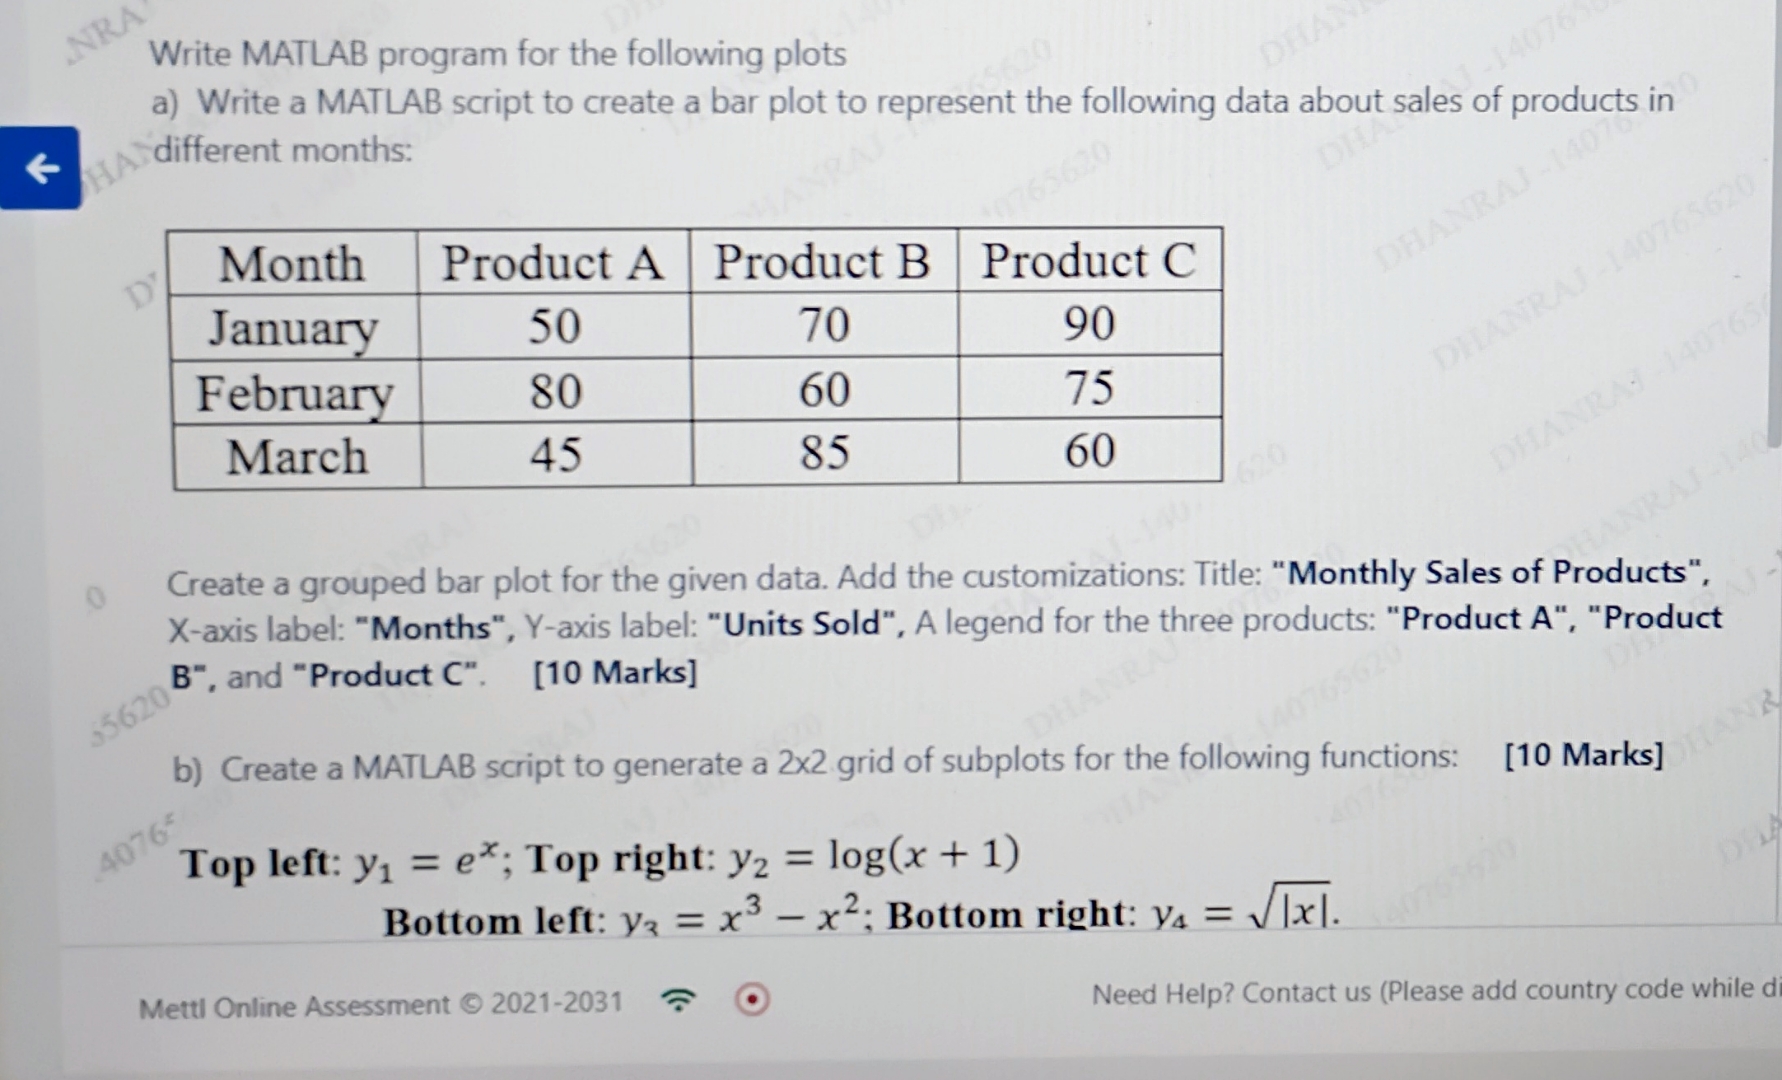
a Write a MATLAB script to create a bar plot to represent the following data about sales of products in different months:
tableMonthProduct AProduct BProduct CJanuaryFebruaryMarch
Create a grouped bar plot for the given data. Add the customizations: Title: "Monthly Sales of Products", Xaxis label: "Months", Yaxis label: "Units Sold", A legend for the three products: "Product A "Product B and "Product C Marks
b Create a MATLAB script to generate a grid of subplots for the following functions:
Marks
Top left: ; Top right:
Bottom left: ; Bottom right:
MettI Online Assessment c
Need Help? Contact us Please add country code while d
Step by Step Solution
There are 3 Steps involved in it
1 Expert Approved Answer
Step: 1 Unlock

Question Has Been Solved by an Expert!
Get step-by-step solutions from verified subject matter experts
Step: 2 Unlock
Step: 3 Unlock