

Question: write neatly and solve On the graph below, ( a ) plot the gradation curve for a soil with these results from a sieve analysis:
write neatly and solve On the graph below, a plot the gradation curve for a soil with these results from a sieve analysis: For this soil, b determine the percentage of gravel, sand, and fines in the soil by the Unified Soil Classification System USCS and provide the USCS designation for this soil; and c sketch on the graph the gradation curves for this soil, a wellgraded sandy gravel, and a nonplastic silty sand.For this soil, and
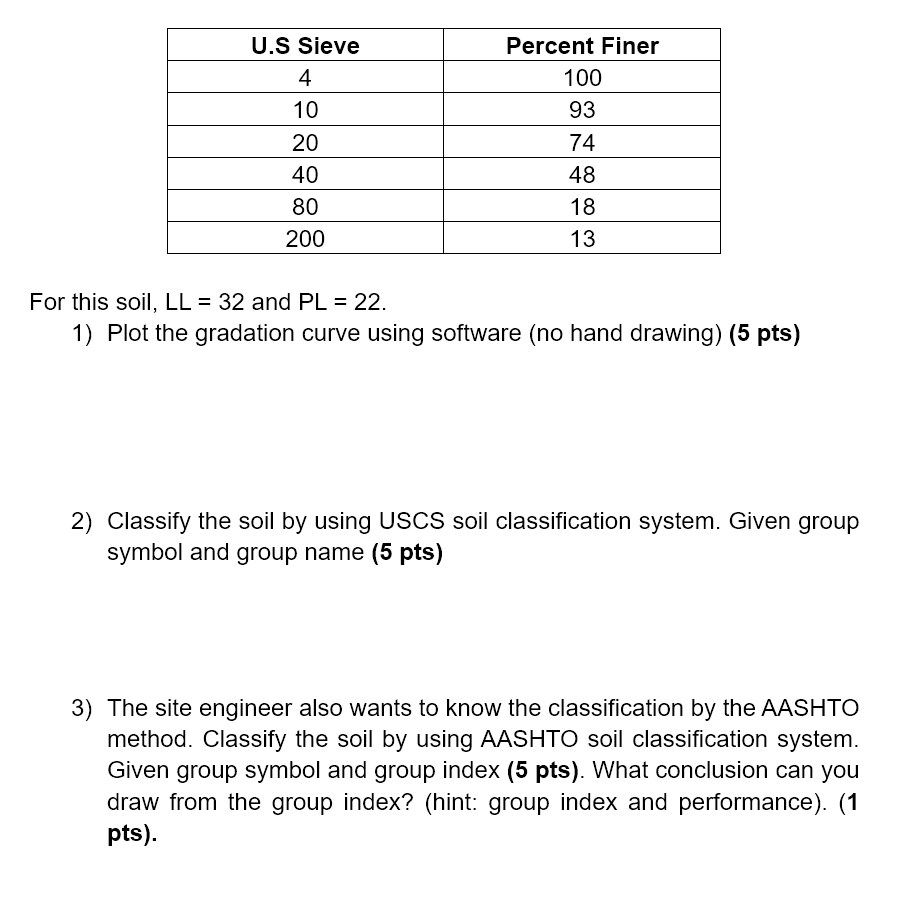
Plot the gradation curve using software no hand drawing pts
Classify the soil by using USCS soil classification system. Given group
symbol and group name pts
The site engineer also wants to know the classification by the AASHTO
method. Classify the soil by using AASHTO soil classification system.
Given group symbol and group index pts What conclusion can you
draw from the group index? hint: group index and performance
pts
Step by Step Solution
There are 3 Steps involved in it
1 Expert Approved Answer
Step: 1 Unlock

Question Has Been Solved by an Expert!
Get step-by-step solutions from verified subject matter experts
Step: 2 Unlock
Step: 3 Unlock