

Question: Write out formula for Excel functions with inputs. Problem 6-4 The table below summarizes prices (per $100 face value) of various default-free zero-coupon bonds (expressed
Write out formula for Excel functions with inputs.
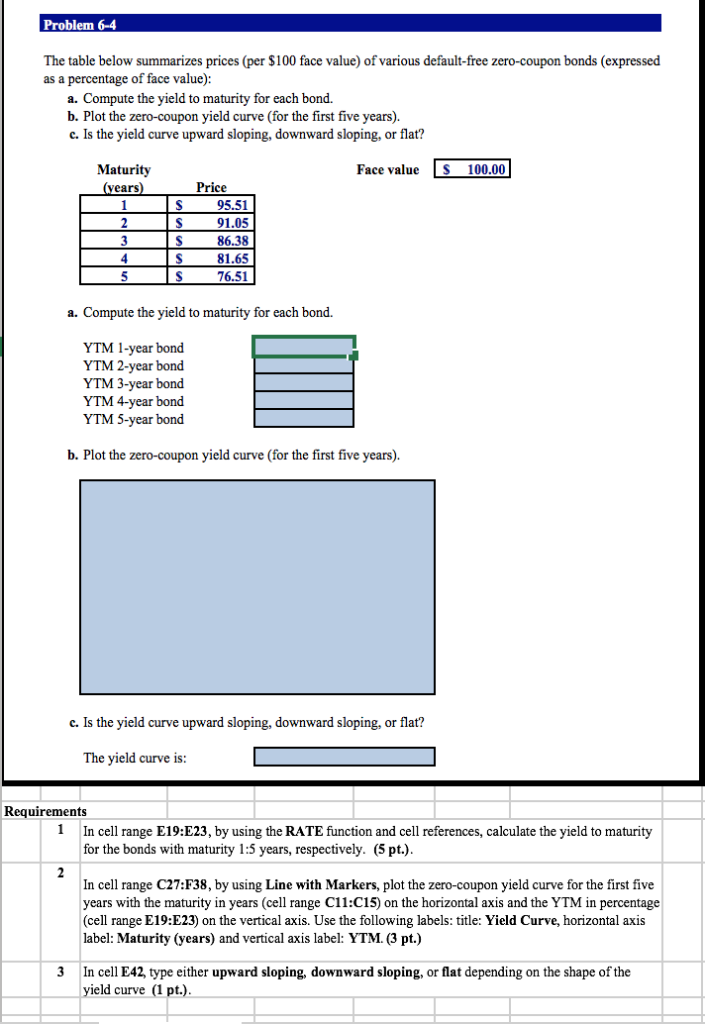
Problem 6-4 The table below summarizes prices (per $100 face value) of various default-free zero-coupon bonds (expressed as a percentage of face value): a. Compute the yield to maturity for each bond. b. Plot the zero-coupon yield curve (for the first five years) c. Is the yield curve upward sloping, downward sloping, or flat? Maturity Face value S 100.00 vears Price 95.51 91.05 86.38 81.65 76.51 a. Compute the yield to maturity for each bond. YTM 1-year bond YTM 2-year bond YTM 3-year bond YTM 4-year bond YTM 5-year bond b. Plot the zero-coupon yield curve (for the first five years). c. Is the yield curve upward sloping, downward sloping, or flat? The yield curve is Requirements 1 In cell range E19:E23, by using the RATE function and cell references, calculate the yield to maturity for the bonds with maturity 1:5 years, respectively. (5 pt.) In cell range C27:F38, by using Line with Markers, plot the zero-coupon yield curve for the first five years with the maturity in years (cell range C11:C15) on the horizontal axis and the YTM in percentage (cell range E19:E23) on the vertical axis. Use the following labels: title: Yield Curve, horizontal axis label: Maturity (years) and vertical axis label: YTM. (3 pt.) 3In cell E42, type either upward sloping, downward sloping, or flat depending on the shape of the yield curve (1 pt.)
Step by Step Solution
There are 3 Steps involved in it

Get step-by-step solutions from verified subject matter experts