

Question: Problem 6-4 The table below summarizes prices (per $100 face value) of various default-free zero-coupon bonds (expressed as a percentage of face value): a. Compute
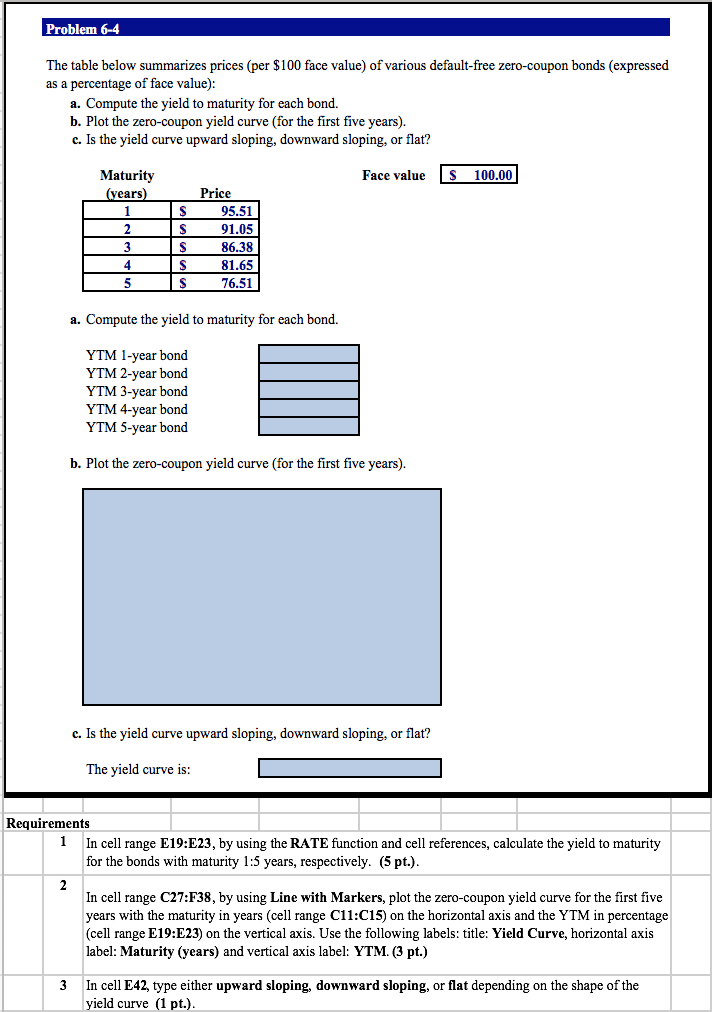
Problem 6-4 The table below summarizes prices (per $100 face value) of various default-free zero-coupon bonds (expressed as a percentage of face value): a. Compute the yield to maturity for each bond. b. Plot the zero-coupon yield curve (for the first five years). c. Is the yield curve upward sloping, downward sloping, or flat? Maturity Face value S100.00 ears Price 95.51 91.05 86.38 81.65 76.51 a. Compute the yield to maturity for each bond. YTM 1-year bond YTM 2-year bond YTM 3-year bond YTM 4-year bond YTM 5-year bond b. Plot the zero-coupon yield curve (for the first five years). c. Is the yield curve upward sloping, downward sloping, or flat? The yield curve is Requirements 1 In cell range E19:E23, by using the RATE function and cell references, calculate the yield to maturity for the bonds with maturity 1:5 years, respectively. (S pt.) In cell range C27:F38, by using Line with Markers, plot the zero-coupon yield curve for the first five years with the maturity in years (cell range Cll:C15) on the horizontal axis and the YTM in percentage (cell range E19:E23) on the vertical axis. Use the following labels: title: Yield Curve, horizontal axis label: Maturity (years) and vertical axis label: YTM. (3 pt.) 3In cell E42, type either upward sloping, downward sloping, or flat depending on the shape of the yield curve (1 pt.) Problem 6-4 The table below summarizes prices (per $100 face value) of various default-free zero-coupon bonds (expressed as a percentage of face value): a. Compute the yield to maturity for each bond. b. Plot the zero-coupon yield curve (for the first five years). c. Is the yield curve upward sloping, downward sloping, or flat? Maturity Face value S100.00 ears Price 95.51 91.05 86.38 81.65 76.51 a. Compute the yield to maturity for each bond. YTM 1-year bond YTM 2-year bond YTM 3-year bond YTM 4-year bond YTM 5-year bond b. Plot the zero-coupon yield curve (for the first five years). c. Is the yield curve upward sloping, downward sloping, or flat? The yield curve is Requirements 1 In cell range E19:E23, by using the RATE function and cell references, calculate the yield to maturity for the bonds with maturity 1:5 years, respectively. (S pt.) In cell range C27:F38, by using Line with Markers, plot the zero-coupon yield curve for the first five years with the maturity in years (cell range Cll:C15) on the horizontal axis and the YTM in percentage (cell range E19:E23) on the vertical axis. Use the following labels: title: Yield Curve, horizontal axis label: Maturity (years) and vertical axis label: YTM. (3 pt.) 3In cell E42, type either upward sloping, downward sloping, or flat depending on the shape of the yield curve (1 pt.)
Step by Step Solution
There are 3 Steps involved in it

Get step-by-step solutions from verified subject matter experts