

Question: Write probability analysis for this company Formatting as Table Styles C8 fx =C6/07 A B D E F G . T J K L 2017
Write probability analysis for this company
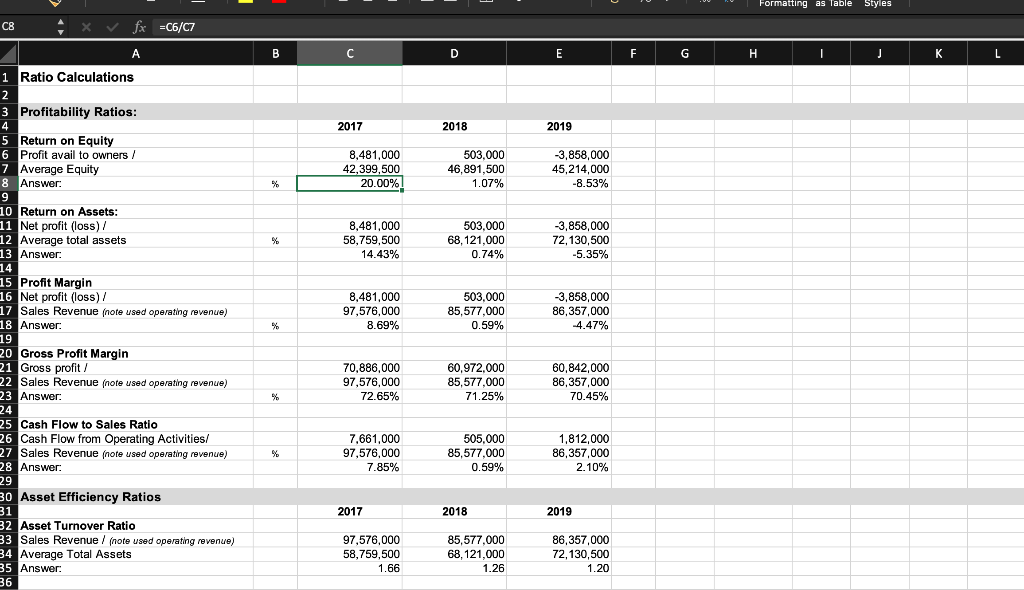
Formatting as Table Styles C8 fx =C6/07 A B D E F G . T J K L 2017 2018 2019 8,481,000 42,399,500 20.00% 503,000 46,891,500 1.07% -3,858,000 45,214,000 -8.53% % %. 8,481,000 58,759,500 14.43% 503,000 68,121,000 0.74% -3,858,000 72,130,500 -5.35% 1 Ratio Calculations 2 3 Profitability Ratios: 4 Return on Equity 6 Profit avail to owners/ 7 Average Equity 8 Answer: 9 10 Return on Assets: 11 Net profit (loss) / 12 Average total assets 13 Answer: 14 15 Profit Margin 16 Net profit (loss) / 17 Sales Revenue (note used operating revenue) 18 Answer: 19 20 Gross Profit Margin 21 Gross profit / 22 Sales Revenue (note used operating revenue) 23 Answer: 24 25 Cash Flow to Sales Ratio 26 Cash Flow from Operating Activities/ 27 Sales Revenue (note used operating revenue) 28 Answer: 29 30 Asset Efficiency Ratios 31 32 Asset Turnover Ratio 33 Sales Revenue / (note used operating revenue) 34 Average Total Assets 35 Answer: 36 8,481,000 97,576,000 8.69% 503,000 85,577,000 0.59% 3,858,000 86,357,000 -4.47% % 70,886,000 97,576,000 72.65% 60,972,000 85,577,000 71.25% 60,842,000 86,357,000 70.45% % %. 7,661,000 97,576,000 7.85% 505,000 85,577,000 0.59% 1,812,000 86,357,000 2.10% 2017 2018 2019 97,576,000 58,759,500 1.66 85,577,000 68,121,000 1.26 86,357,000 72,130,500 1.20
Step by Step Solution
There are 3 Steps involved in it

Get step-by-step solutions from verified subject matter experts