

Question: Write the code in Matlab to graph the following signals. (The signals in Fig. P3.3-6 are modulated signals with carrier cos 10t. Find the Fourier
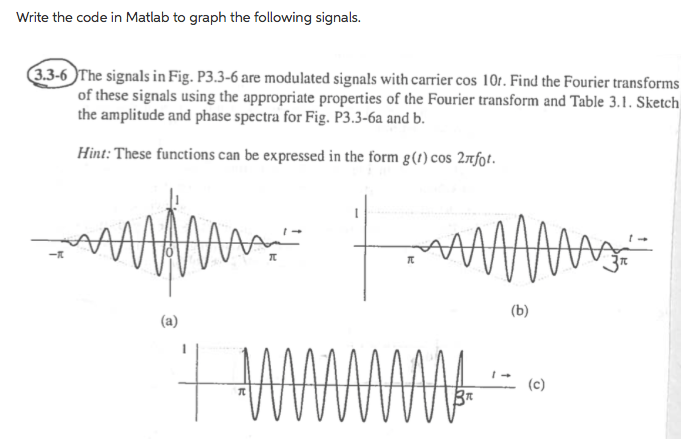
Write the code in Matlab to graph the following signals. (The signals in Fig. P3.3-6 are modulated signals with carrier cos 10t. Find the Fourier transforms of these signals using the appropriate properties of the Fourier transform and Table 3.1. Sketch the amplitude and phase spectra for Fig. P3.3-6a and b
Step by Step Solution
There are 3 Steps involved in it
1 Expert Approved Answer
Step: 1 Unlock

Question Has Been Solved by an Expert!
Get step-by-step solutions from verified subject matter experts
Step: 2 Unlock
Step: 3 Unlock