

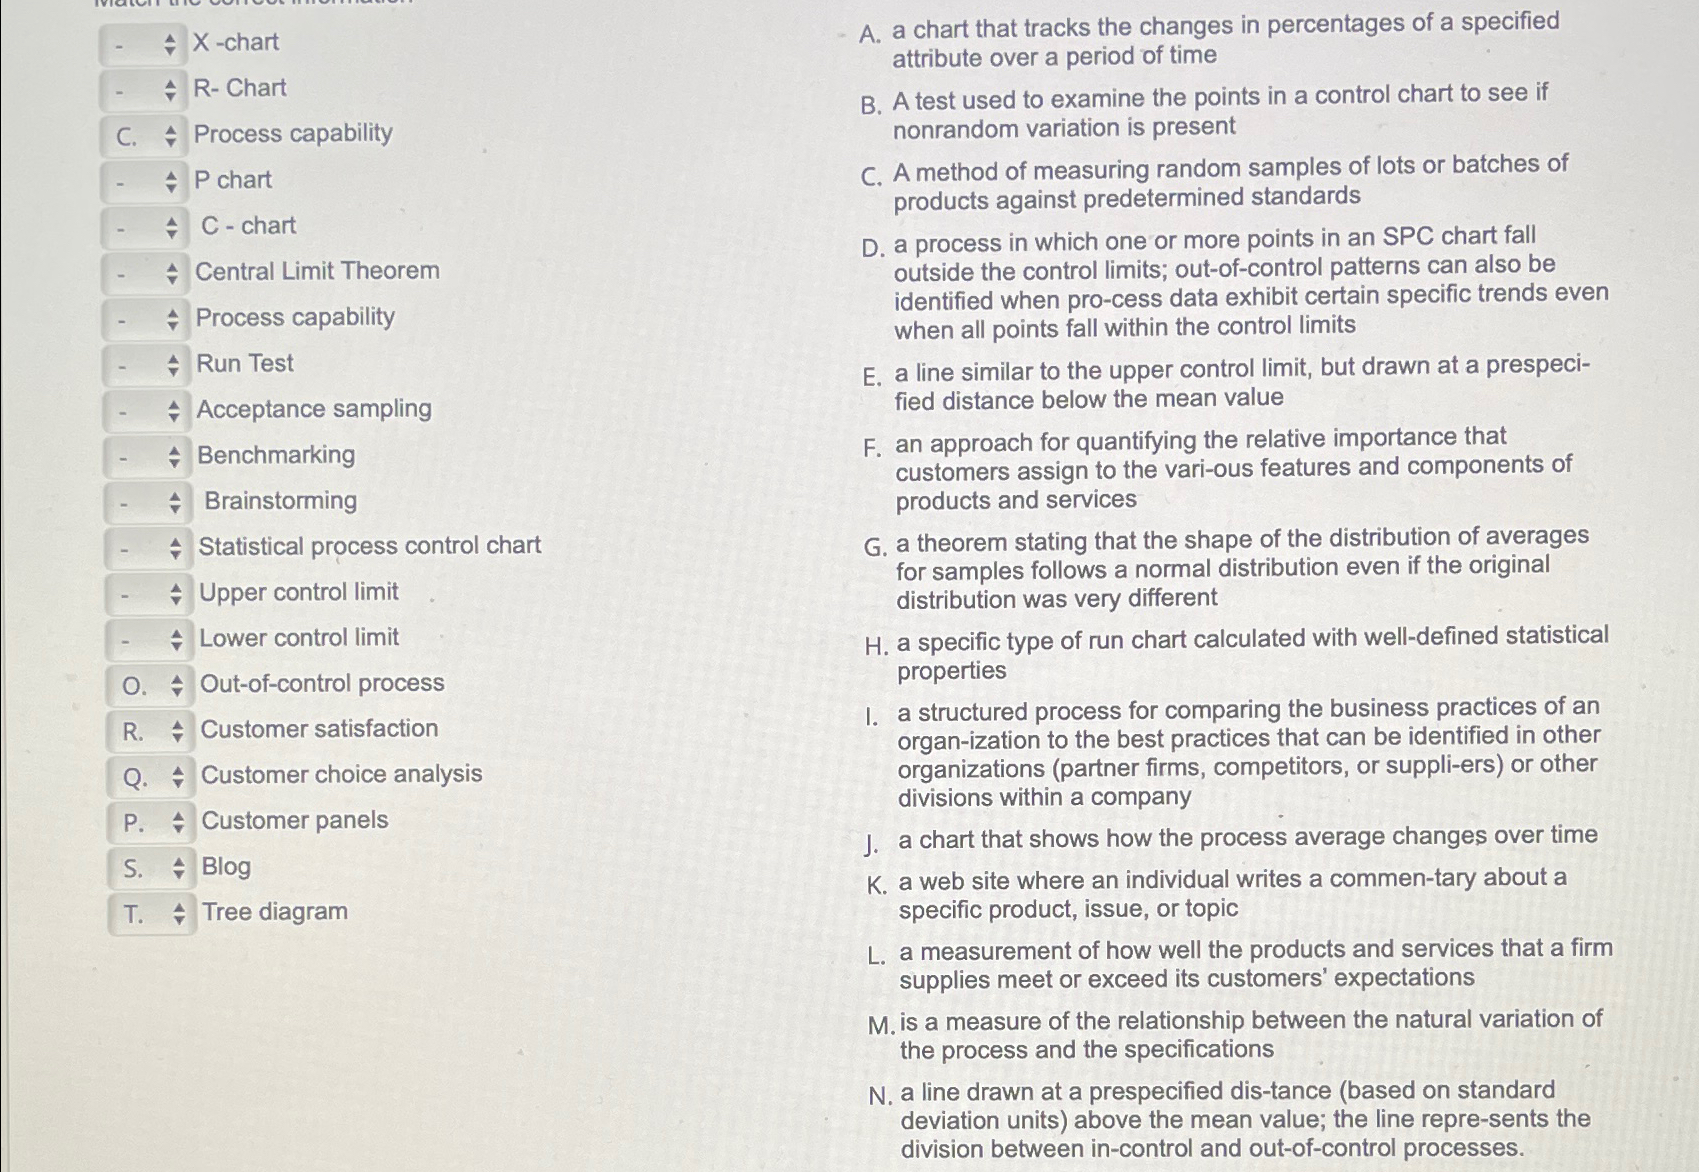
Question: X - chart R - Chart C . Process capability P chart C - chart Central Limit Theorem Process capability Run Test Acceptance sampling Benchmarking
X chart
Chart
C Process capability
chart
C chart
Central Limit Theorem
Process capability
Run Test
Acceptance sampling
Benchmarking
Brainstorming
Statistical process control chart
Upper control limit
Lower control limit
O Outofcontrol process
R Customer satisfaction
Q Customer choice analysis
P
S $ Blog
T Tree diagram
A a chart that tracks the changes in percentages of a specified attribute over a period of time
B A test used to examine the points in a control chart to see if nonrandom variation is present
C A method of measuring random samples of lots or batches of products against predetermined standards
D a process in which one or more points in an SPC chart fall outside the control limits; outofcontrol patterns can also be identified when process data exhibit certain specific trends even when all points fall within the control limits
E a line similar to the upper control limit but drawn at a prespecified distance below the mean value
F an approach for quantifying the relative importance that customers assign to the various features and components of products and services
G a theorem stating that the shape of the distribution of averages for samples follows a normal distribution even if the original distribution was very different
H a specific type of run chart calculated with welldefined statistical properties
I. a structured process for comparing the business practices of an organization to the best practices that can be identified in other organizations partner firms, competitors, or suppliers or other divisions within a company
J a chart that shows how the process average changes over time
K a web site where an individual writes a commentary about a specific product, issue, or topic
L a measurement of how well the products and services that a firm supplies meet or exceed its customers' expectations
is a measure of the relationship between the natural variation of the process and the specifications
N a line drawn at a prespecified distance based on standard deviation units above the mean value; the line represents the division between incontrol and outofcontrol processes.
Step by Step Solution
There are 3 Steps involved in it
1 Expert Approved Answer
Step: 1 Unlock

Question Has Been Solved by an Expert!
Get step-by-step solutions from verified subject matter experts
Step: 2 Unlock
Step: 3 Unlock