

Question: - X Table The following data represent the speed at which a ball was hit (in miles per hour) and the distance it traveled (in
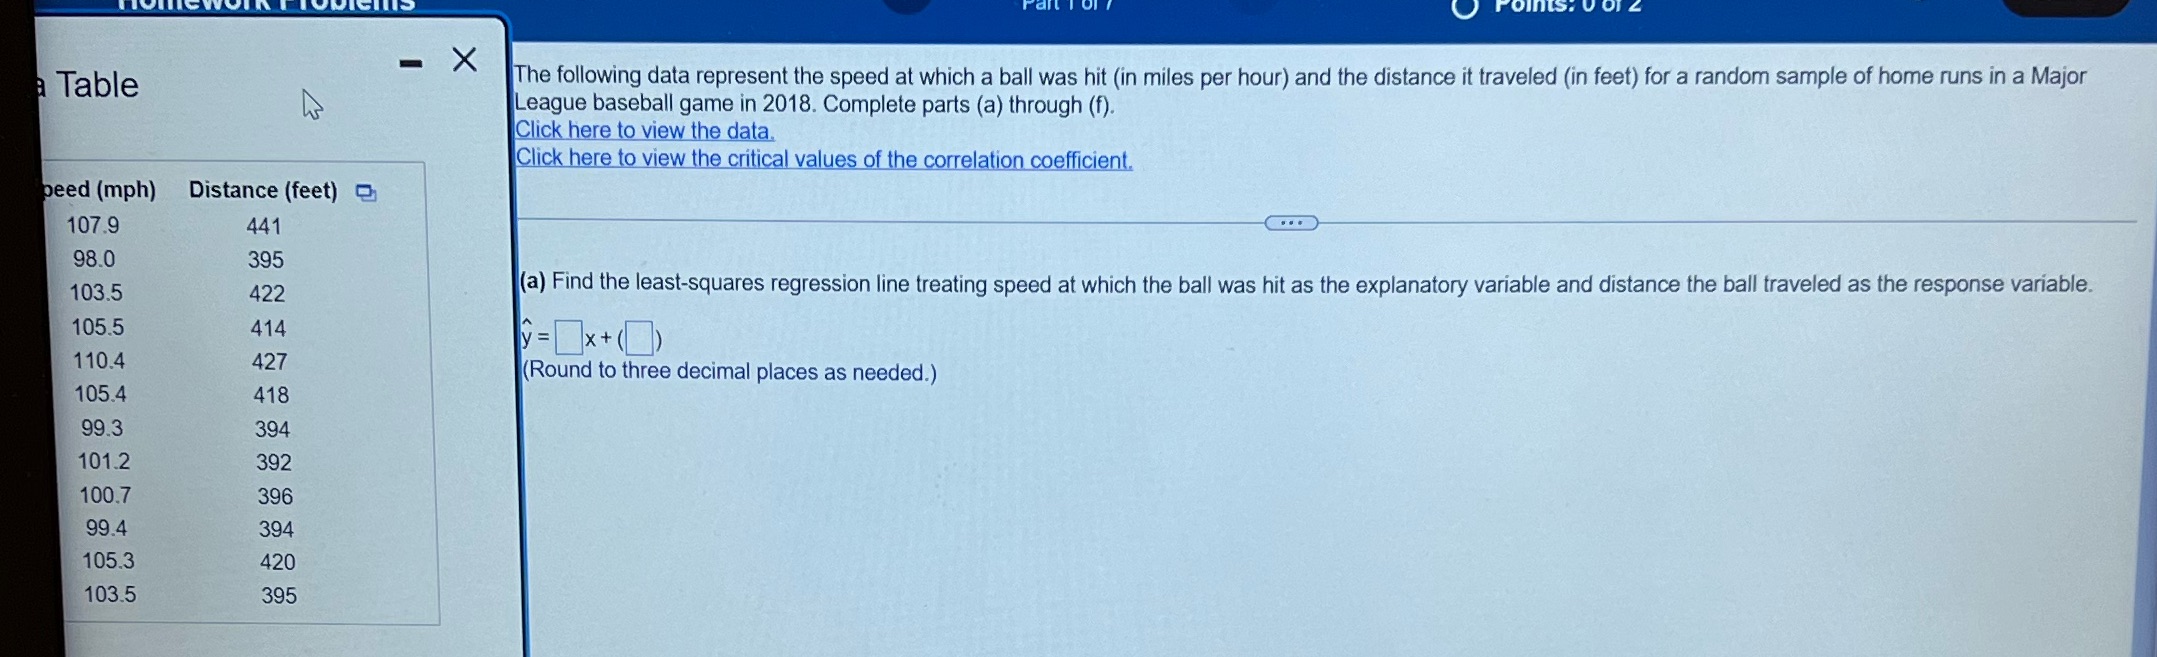
- X Table The following data represent the speed at which a ball was hit (in miles per hour) and the distance it traveled (in feet) for a random sample of home runs in a Major League baseball game in 2018. Complete parts (a) through (f). Click here to view the data. Click here to view the critical values of the correlation coefficient. peed (mph) Distance (feet) 107.9 441 98.0 395 103.5 422 (a) Find the least-squares regression line treating speed at which the ball was hit as the explanatory variable and distance the ball traveled as the response variable. 105.5 414 y = x +( 0) 110.4 427 (Round to three decimal places as needed.) 105.4 418 99.3 394 101.2 392 100.7 396 99.4 394 105.3 420 103.5 395
Step by Step Solution
There are 3 Steps involved in it

Get step-by-step solutions from verified subject matter experts