

Question: Table The following data represent the speed at which a ball was hit (in miles per hour) and the distance it traveled (in feet) for
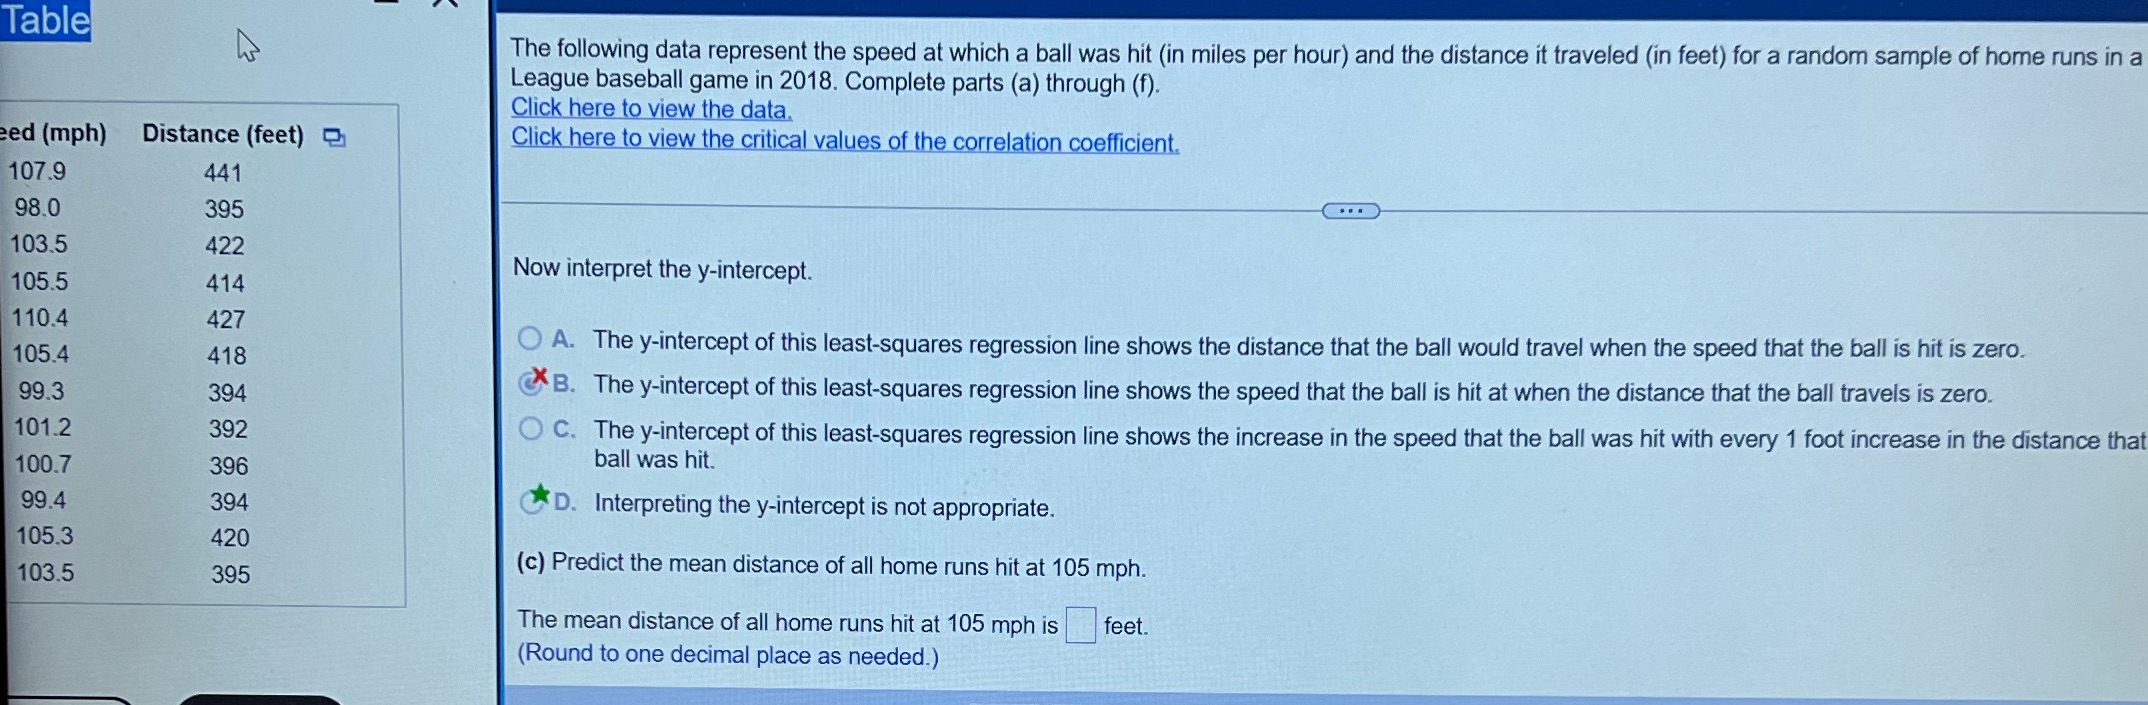
Table The following data represent the speed at which a ball was hit (in miles per hour) and the distance it traveled (in feet) for a random sample of home runs in a League baseball game in 2018. Complete parts (a) through (f). Click here to view the data. ed (mph) Distance (feet) Click here to view the critical values of the correlation coefficient. 107.9 441 98.0 395 103.5 422 105.5 414 Now interpret the y-intercept. 110.4 427 105.4 418 O A. The y-intercept of this least-squares regression line shows the distance that the ball would travel when the speed that the ball is hit is zero. 99.3 394 X B. The y-intercept of this least-squares regression line shows the speed that the ball is hit at when the distance that the ball travels is zero. 101.2 392 O C. The y-intercept of this least-squares regression line shows the increase in the speed that the ball was hit with every 1 foot increase in the distance that 100.7 396 ball was hit. 99.4 394 D. Interpreting the y-intercept is not appropriate. 105.3 420 103.5 395 (c) Predict the mean distance of all home runs hit at 105 mph. The mean distance of all home runs hit at 105 mph is feet. (Round to one decimal place as needed.)
Step by Step Solution
There are 3 Steps involved in it

Get step-by-step solutions from verified subject matter experts