

Question: X-Bar Control Limits Upper 21.56 Lower 3.40 R Control Limits Upper 33.27 Lower 0 how can we sure about process is in control or not?
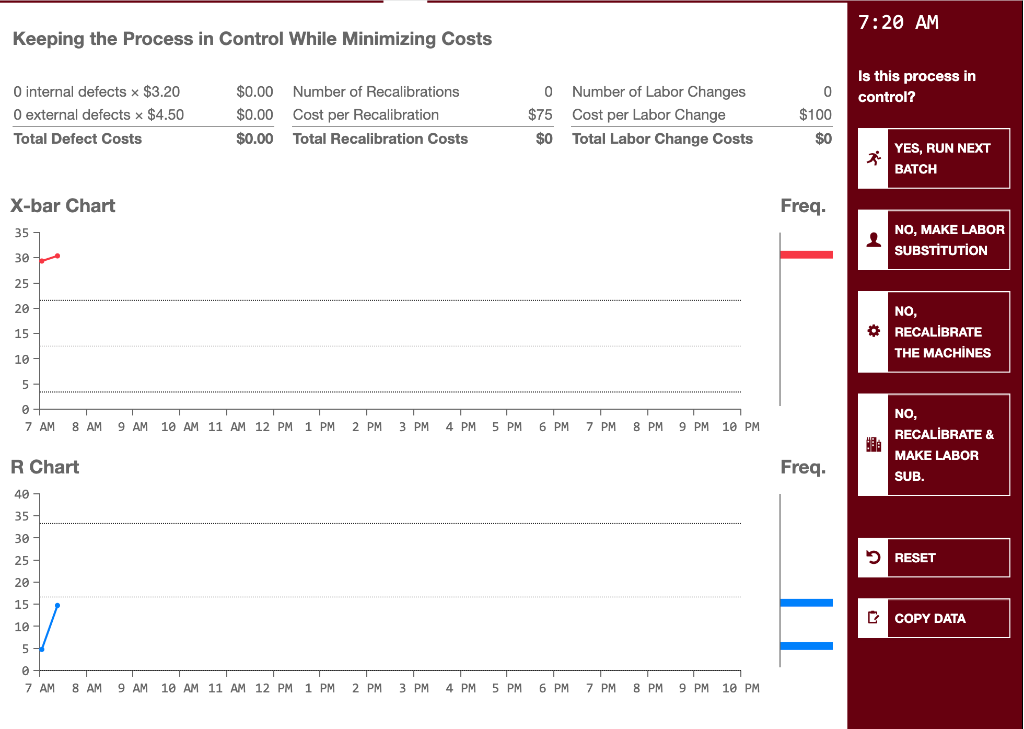
X-Bar Control Limits
Upper 21.56
Lower 3.40
R Control Limits
Upper 33.27
Lower 0
how can we sure about process is in control or not? If not in control How can choose the changes in labor and machines ?
Keeping the Process in Control While Minimizing Costs O internal defects x $3.20 O external defects x $4.50 Total Defect Costs $0.00 Number of Recalibrations $0.00 Cost per Recalibration $0.00 0 $75 $0 Total Recalibration Costs X-bar Chart 35 30 25 20 15 10 8 AM 9 AM 10 AM 11 AM 12 PM 1 PM 2 PM 3 PM 4 PM 5 PM 2 PM 3 PM 4 PM 5 PM 5 0 7 AM R Chart 40 35 30 - 25 20 15 10- 5 0 7 AM 8 AM 9 AM 10 AM 11 AM 12 PM 1 PM Number of Labor Changes Cost per Labor Change Total Labor Change Costs 8 PM 6 PM 7 PM 6 PM 7 PM 8 PM 9 PM 10 PM 9 PM 10 PM 0 $100 $0 Freq. Freq. 7:20 AM Is this process in control? 3 1 YES, RUN NEXT BATCH NO, MAKE LABOR SUBSTITUTION NO, RECALIBRATE THE MACHINES NO, RECALIBRATE & MAKE LABOR SUB. RESET COPY DATA
Step by Step Solution
There are 3 Steps involved in it
1 Expert Approved Answer
Step: 1 Unlock

Question Has Been Solved by an Expert!
Get step-by-step solutions from verified subject matter experts
Step: 2 Unlock
Step: 3 Unlock