

Question: Calculate the 2 sigma x-chart control limits (upper and lower) The overall average on a process you are attempting to monitor is 55.0 units. The
Calculate the 2 sigma x-chart control limits (upper and lower)
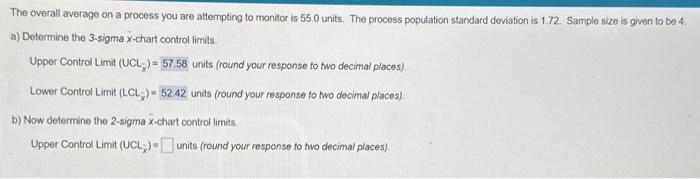
The overall average on a process you are attempting to monitor is 55.0 units. The process population standard deviation is 1.72 . Sample size is given to be 4. a) Determine the 3 -sigma x-chart control limits. Upper Control Limit (UCLx^)=57.58 units (round your response to two decimal places) Lower Control Limit (LCLx)=52.42 units (round your response to two decimal places) b) Now determine the 2-sigma x-chart control limits. Upper Control Limit (UCLx)= units (round your response to two decimal places)
Step by Step Solution
There are 3 Steps involved in it
1 Expert Approved Answer
Step: 1 Unlock

Question Has Been Solved by an Expert!
Get step-by-step solutions from verified subject matter experts
Step: 2 Unlock
Step: 3 Unlock