

Question: y! chegg study - c Get Homework X C Th C ezto.mheducation.com/ext/map/ Assignment 11 Ch 17 The condensed comparative statements of Uranium Mining Corporation follow:
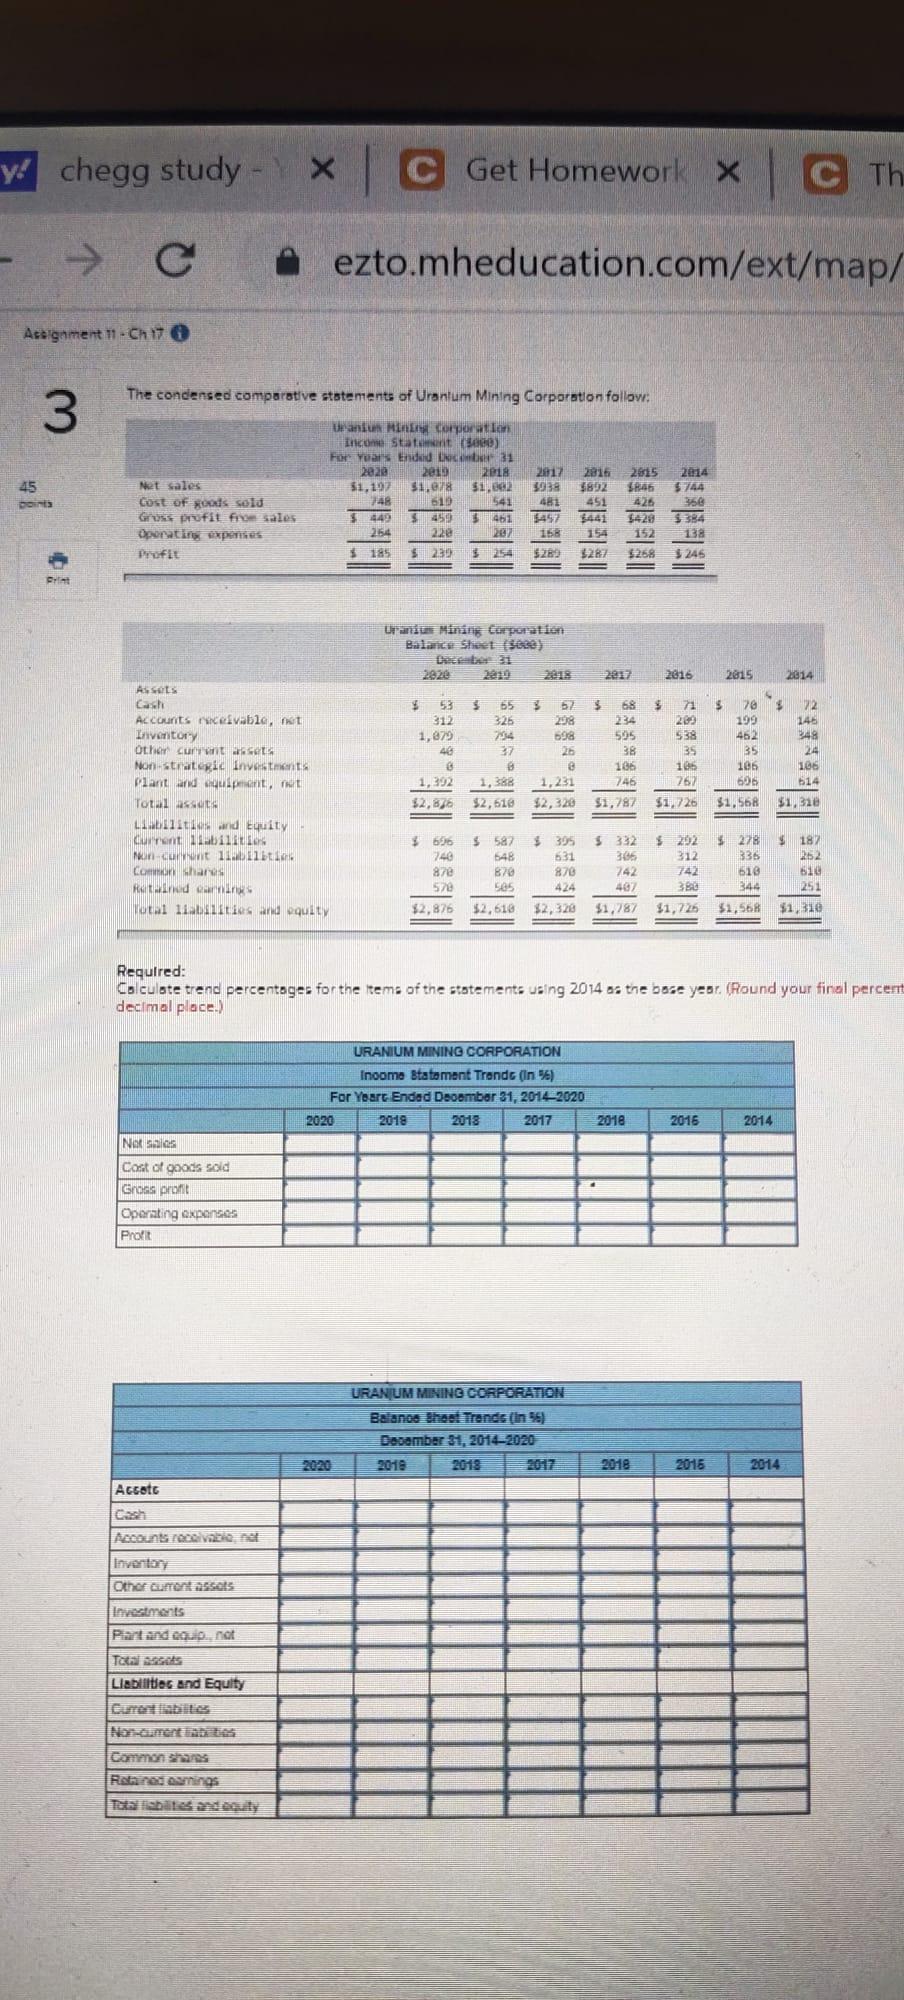
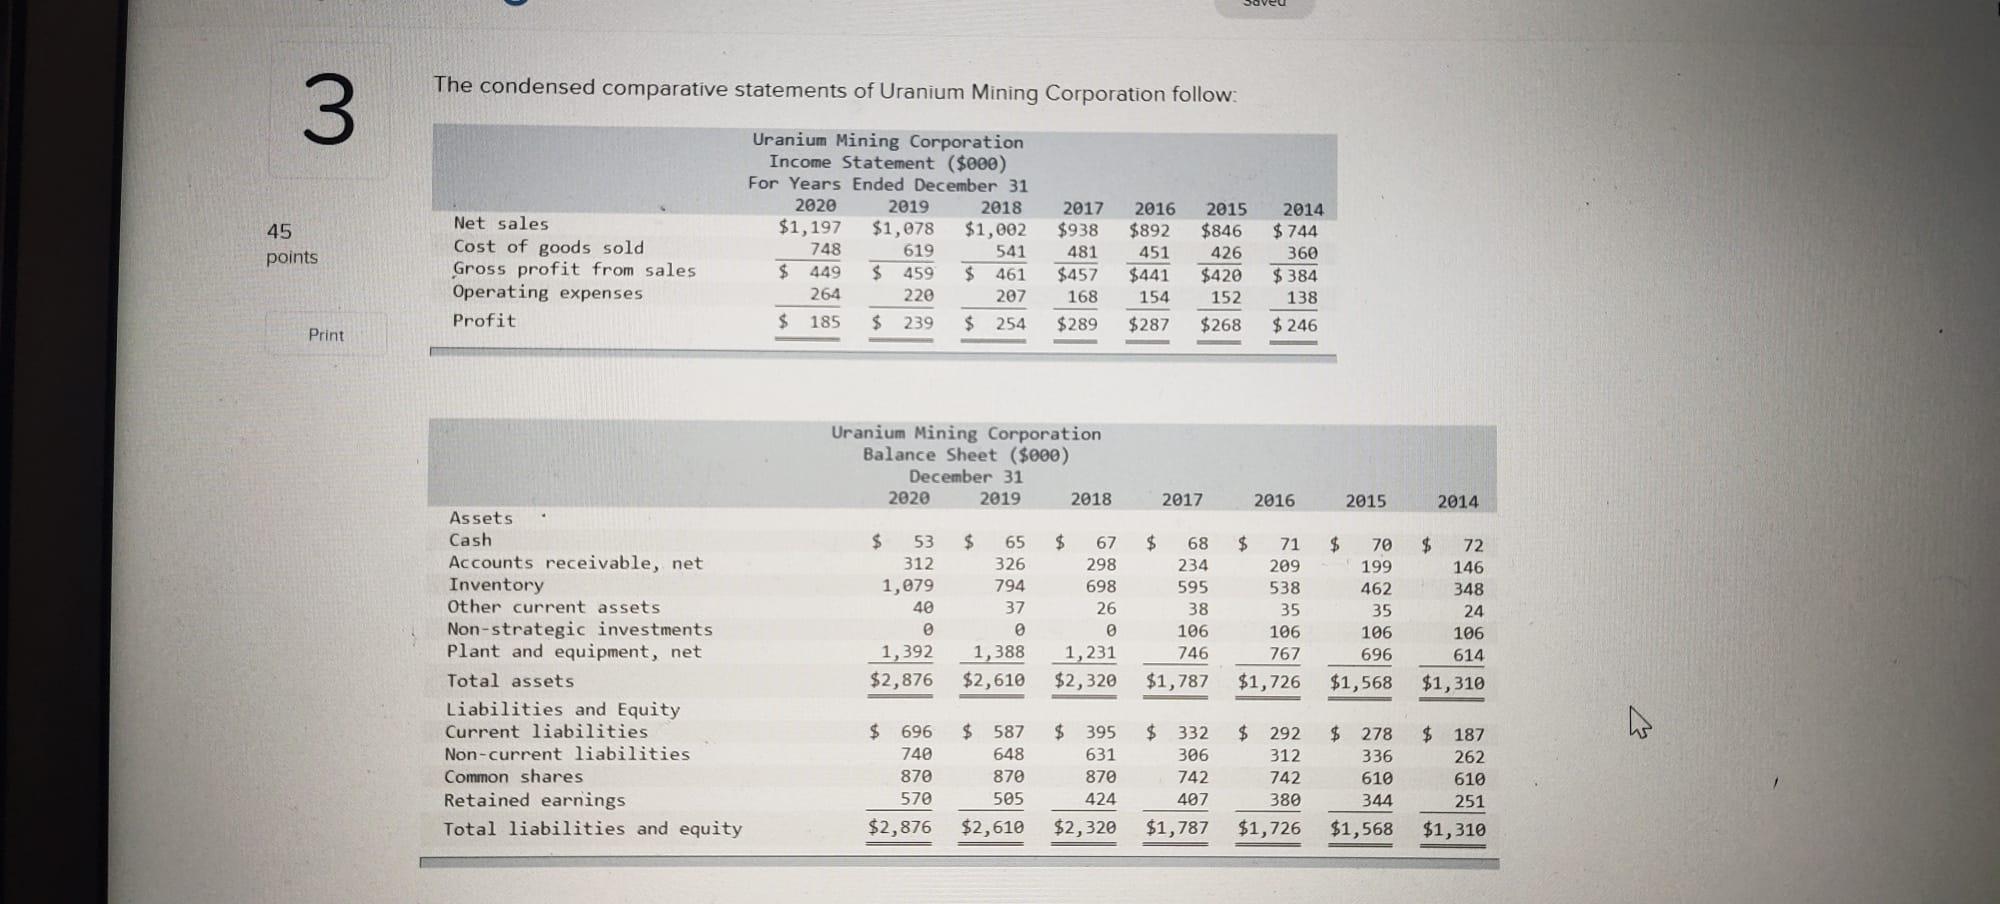
y! chegg study - c Get Homework X C Th C ezto.mheducation.com/ext/map/ Assignment 11 Ch 17 The condensed comparative statements of Uranium Mining Corporation follow: 3 45 Doint Wantun Mincorporation Income Statement (CD) For yuan's Ended licember 31 2020 2019 2018 $1,197 $1.07 $1,02 148 619 541 5449 399 461 254 202 $185 235 2816 $892 451 2014 $144 Net Sales Gost of mots sets GUS profit from sales Operating expenses Profit 2012 3938 483 57 168 $282 2015 S5 426 $428 152 $268 84 18 154 $287 $245 Uranin Mining Corporation Balance sheet See) Deceber 31 2019 2018 2017 2016 2015 2014 $ $ $ $ 53 312 1,879 40 3 65 325 2014 32 a 1,388 $2,618 3 b 208 698 26 @ 1,231 $2,320 68 234 535 38 106 745 Assets Cash Accounts receivable, not Inventory Other current assets Non strategic investments plant and equipment, ut Total assume Lalities and Equity current all Nun current biti Command Rutanud en TUDI Labilities and equity $ 21 283 538 35 106 752 $1,726 78 199 462 35 105 606 72 145 348 24 106 514 1,392 $2,87 $1,787 $1,568 $1,310 $ 6:36 746 878 570 $2,876 $ 587 548 879 525 $ 395 531 870 424 $2,328 $ 332 366 742 402 $1,787 $ 292 312 742 380 $ 278 335 618 344 $ 187 252 B10 1251 $2,610 $1,724 51,568 $1,310 Required: Calculate trend percentages for the tems of the statements using 2014 as the bese year. (Round your final percent decimal place.) URANIUM MINING CORPORATION Income statement Trends (In") For Yoart Ended December 31, 2014-2020 2020 2018 2018 2017 2018 2016 2014 No salos Cost of goods sold Gross profit Operating expenses Profit URANUM MINING CORPORATION Beans Trends in 56) December 31, 2014-2020 2010 2018 2018 2016 2014 Accotc Decounts receivabinet Inventory Other current scots Investments Pandega.net Total seats Liabilities and Equity Worcement anties Common Shares Falanes omnings To liabites a quity The condensed comparative statements of Uranium Mining Corporation follow: 3 45 points Net sales Cost of goods sold Gross profit from sales Operating expenses Profit Uranium Mining Corporation Income Statement ($000) For Years Ended December 31 2020 2019 2018 $1,197 $1,078 $1,002 748 619 541 $ 449 $ 459 $ 461 264 220 207 $ 185 $ 239 $ 254 2017 $938 481 $457 168 $289 2016 $892 451 $441 154 $287 2015 $846 426 $420 152 $268 2014 $ 744 360 $ 384 138 $ 246 Print Uranium Mining Corporation Balance Sheet ($000) December 31 2020 2019 2018 2017 2016 2015 2014 $ $ 70 199 462 $ 53 312 1,079 40 1,392 $2,876 67 298 698 26 Assets Cash Accounts receivable, net Inventory Other current assets Non-strategic investments Plant and equipment, net Total assets Liabilities and Equity Current liabilities Non-current liabilities Common shares Retained earnings Total liabilities and equity $ 65 326 794 37 0 1,388 $2,610 $ 68 234 595 38 106 746 $1,787 $ 71 209 538 35 106 767 $1,726 35 106 696 $ 72 146 348 24 106 614 $1,310 1,231 $2,320 $1,568 Q $ 696 740 870 570 $2,876 $ 587 648 870 505 $ 395 631 870 424 $ 332 306 742 407 $1,787 $ 292 312 742 380 $1,726 $ 278 336 610 344 $1,568 $ 187 262 610 251 $2,610 $2,320 $1,310
Step by Step Solution
There are 3 Steps involved in it

Get step-by-step solutions from verified subject matter experts