

Yann grew up in Normandy of France and then moved to the US working in hospitality...
Fantastic news! We've Found the answer you've been seeking!
Question:
Transcribed Image Text:
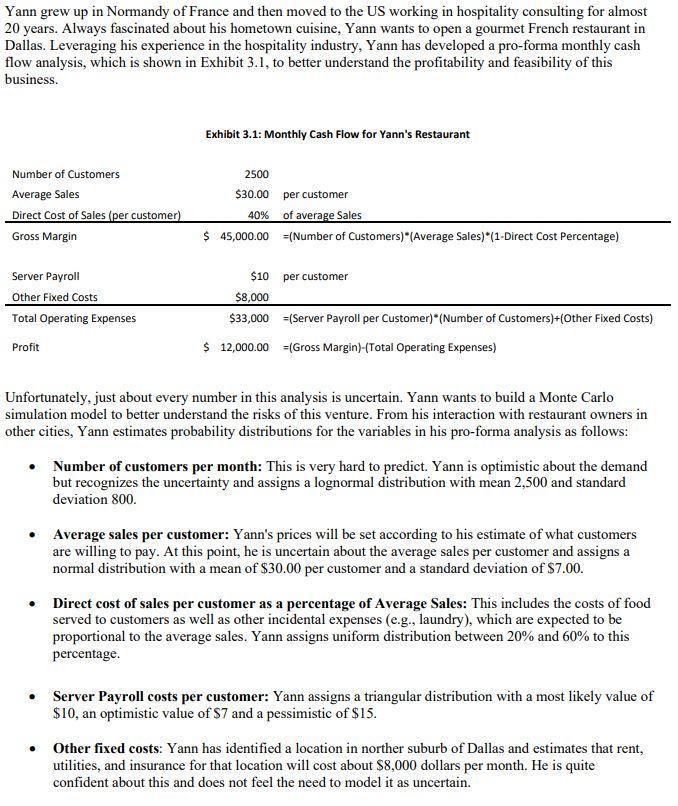
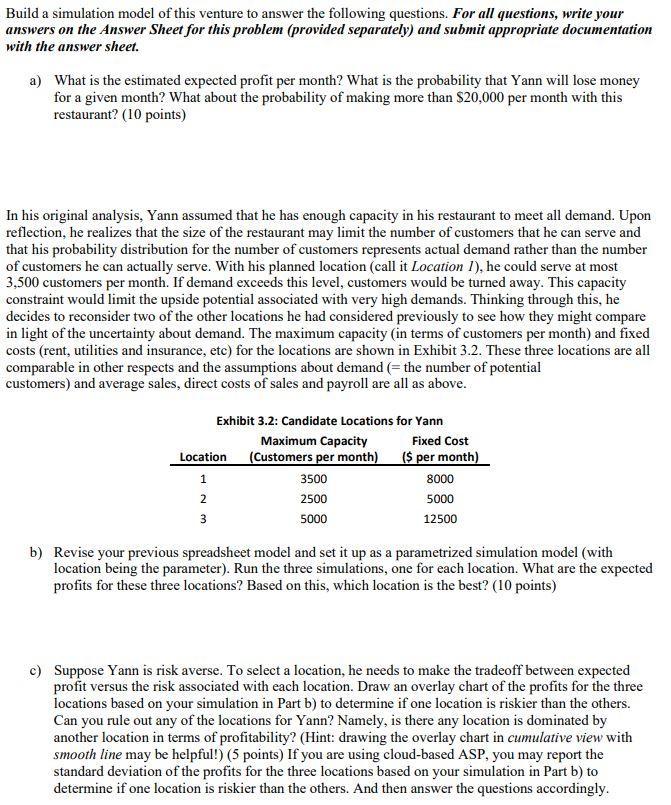
Yann grew up in Normandy of France and then moved to the US working in hospitality consulting for almost 20 years. Always fascinated about his hometown cuisine, Yann wants to open a gourmet French restaurant in Dallas. Leveraging his experience in the hospitality industry, Yann has developed a pro-forma monthly cash flow analysis, which is shown in Exhibit 3.1, to better understand the profitability and feasibility of this business. Number of Customers Average Sales Direct Cost of Sales (per customer) Gross Margin Server Payroll Other Fixed Costs Total Operating Expenses Profit Exhibit 3.1: Monthly Cash Flow for Yann's Restaurant 2500 $30.00 per customer 40% of average Sales $ 45,000.00 $10 $8,000 $33,000 $ 12,000.00 =(Number of Customers) (Average Sales)*(1-Direct Cost Percentage) per customer =(Server Payroll per Customer)*(Number of Customers)+(Other Fixed Costs) =(Gross Margin)-(Total Operating Expenses) Unfortunately, just about every number in this analysis is uncertain. Yann wants to build a Monte Carlo simulation model to better understand the risks of this venture. From his interaction with restaurant owners in other cities, Yann estimates probability distributions for the variables in his pro-forma analysis as follows: Number of customers per month: This is very hard to predict. Yann is optimistic about the demand but recognizes the uncertainty and assigns a lognormal distribution with mean 2,500 and standard deviation 800. Average sales per customer: Yann's prices will be set according to his estimate of what customers are willing to pay. At this point, he is uncertain about the average sales per customer and assigns a normal distribution with a mean of $30.00 per customer and a standard deviation of $7.00. Direct cost of sales per customer as a percentage of Average Sales: This includes the costs of food served to customers as well as other incidental expenses (e.g., laundry), which are expected to be proportional to the average sales. Yann assigns uniform distribution between 20% and 60% to this percentage. Server Payroll costs per customer: Yann assigns a triangular distribution with a most likely value of $10, an optimistic value of $7 and a pessimistic of $15. Other fixed costs: Yann has identified a location in norther suburb of Dallas and estimates that rent, utilities, and insurance for that location will cost about $8,000 dollars per month. He is quite confident about this and does not feel the need to model it as uncertain. Build a simulation model of this venture to answer the following questions. For all questions, write your answers on the Answer Sheet for this problem (provided separately) and submit appropriate documentation with the answer sheet. a) What is the estimated expected profit per month? What is the probability that Yann will lose money for a given month? What about the probability of making more than $20,000 per month with this restaurant? (10 points) In his original analysis, Yann assumed that he has enough capacity in his restaurant to meet all demand. Upon reflection, he realizes that the size of the restaurant may limit the number of customers that he can serve and that his probability distribution for the number of customers represents actual demand rather than the number of customers he can actually serve. With his planned location (call it Location 1), he could serve at most 3,500 customers per month. If demand exceeds this level, customers would be turned away. This capacity constraint would limit the upside potential associated with very high demands. Thinking through this, he decides to reconsider two of the other locations he had considered previously to see how they might compare in light of the uncertainty about demand. The maximum capacity (in terms of customers per month) and fixed costs (rent, utilities and insurance, etc) for the locations are shown in Exhibit 3.2. These three locations are all comparable in other respects and the assumptions about demand (= the number of potential customers) and average sales, direct costs of sales and payroll are all as above. Exhibit 3.2: Candidate Locations for Yann Location 1 2 3 Maximum Capacity (Customers per month) 3500 2500 5000 Fixed Cost ($ per month) 8000 5000 12500 b) Revise your previous spreadsheet model and set it up as a parametrized simulation model (with location being the parameter). Run the three simulations, one for each location. What are the expected profits for these three locations? Based on this, which location is the best? (10 points) c) Suppose Yann is risk averse. To select a location, he needs to make the tradeoff between expected profit versus the risk associated with each location. Draw an overlay chart of the profits for the three locations based on your simulation in Part b) to determine if one location is riskier than the others. Can you rule out any of the locations for Yann? Namely, is there any location is dominated by another location in terms of profitability? (Hint: drawing the overlay chart in cumulative view with smooth line may be helpful!) (5 points) If you are using cloud-based ASP, you may report the standard deviation of the profits for the three locations based on your simulation in Part b) to determine if one location is riskier than the others. And then answer the questions accordingly. Yann grew up in Normandy of France and then moved to the US working in hospitality consulting for almost 20 years. Always fascinated about his hometown cuisine, Yann wants to open a gourmet French restaurant in Dallas. Leveraging his experience in the hospitality industry, Yann has developed a pro-forma monthly cash flow analysis, which is shown in Exhibit 3.1, to better understand the profitability and feasibility of this business. Number of Customers Average Sales Direct Cost of Sales (per customer) Gross Margin Server Payroll Other Fixed Costs Total Operating Expenses Profit Exhibit 3.1: Monthly Cash Flow for Yann's Restaurant 2500 $30.00 per customer 40% of average Sales $ 45,000.00 $10 $8,000 $33,000 $ 12,000.00 =(Number of Customers) (Average Sales)*(1-Direct Cost Percentage) per customer =(Server Payroll per Customer)*(Number of Customers)+(Other Fixed Costs) =(Gross Margin)-(Total Operating Expenses) Unfortunately, just about every number in this analysis is uncertain. Yann wants to build a Monte Carlo simulation model to better understand the risks of this venture. From his interaction with restaurant owners in other cities, Yann estimates probability distributions for the variables in his pro-forma analysis as follows: Number of customers per month: This is very hard to predict. Yann is optimistic about the demand but recognizes the uncertainty and assigns a lognormal distribution with mean 2,500 and standard deviation 800. Average sales per customer: Yann's prices will be set according to his estimate of what customers are willing to pay. At this point, he is uncertain about the average sales per customer and assigns a normal distribution with a mean of $30.00 per customer and a standard deviation of $7.00. Direct cost of sales per customer as a percentage of Average Sales: This includes the costs of food served to customers as well as other incidental expenses (e.g., laundry), which are expected to be proportional to the average sales. Yann assigns uniform distribution between 20% and 60% to this percentage. Server Payroll costs per customer: Yann assigns a triangular distribution with a most likely value of $10, an optimistic value of $7 and a pessimistic of $15. Other fixed costs: Yann has identified a location in norther suburb of Dallas and estimates that rent, utilities, and insurance for that location will cost about $8,000 dollars per month. He is quite confident about this and does not feel the need to model it as uncertain. Build a simulation model of this venture to answer the following questions. For all questions, write your answers on the Answer Sheet for this problem (provided separately) and submit appropriate documentation with the answer sheet. a) What is the estimated expected profit per month? What is the probability that Yann will lose money for a given month? What about the probability of making more than $20,000 per month with this restaurant? (10 points) In his original analysis, Yann assumed that he has enough capacity in his restaurant to meet all demand. Upon reflection, he realizes that the size of the restaurant may limit the number of customers that he can serve and that his probability distribution for the number of customers represents actual demand rather than the number of customers he can actually serve. With his planned location (call it Location 1), he could serve at most 3,500 customers per month. If demand exceeds this level, customers would be turned away. This capacity constraint would limit the upside potential associated with very high demands. Thinking through this, he decides to reconsider two of the other locations he had considered previously to see how they might compare in light of the uncertainty about demand. The maximum capacity (in terms of customers per month) and fixed costs (rent, utilities and insurance, etc) for the locations are shown in Exhibit 3.2. These three locations are all comparable in other respects and the assumptions about demand (= the number of potential customers) and average sales, direct costs of sales and payroll are all as above. Exhibit 3.2: Candidate Locations for Yann Location 1 2 3 Maximum Capacity (Customers per month) 3500 2500 5000 Fixed Cost ($ per month) 8000 5000 12500 b) Revise your previous spreadsheet model and set it up as a parametrized simulation model (with location being the parameter). Run the three simulations, one for each location. What are the expected profits for these three locations? Based on this, which location is the best? (10 points) c) Suppose Yann is risk averse. To select a location, he needs to make the tradeoff between expected profit versus the risk associated with each location. Draw an overlay chart of the profits for the three locations based on your simulation in Part b) to determine if one location is riskier than the others. Can you rule out any of the locations for Yann? Namely, is there any location is dominated by another location in terms of profitability? (Hint: drawing the overlay chart in cumulative view with smooth line may be helpful!) (5 points) If you are using cloud-based ASP, you may report the standard deviation of the profits for the three locations based on your simulation in Part b) to determine if one location is riskier than the others. And then answer the questions accordingly.
Expert Answer:
Answer rating: 100% (QA)
Based on the simulation model the expected profits for the three locations are as follows Location A ... View the full answer

Related Book For 

Managerial Economics and Strategy
ISBN: 978-0321566447
1st edition
Authors: Jeffrey M. Perloff, James A. Brander
Posted Date:
Students also viewed these general management questions
-
Pro forma balance sheet Peabody & Peabody has 2015 sales of $10 million. It wishes to analyze expected performance and financing needs for 2017, which is 2 years ahead. Given the following...
-
Customer profitability analysis Using activity-based analysis, you have just prepared a customer profitability report for the sales manager that shows some customer groups are profitable but other...
-
The future is uncertain and so pro forma financial statements will almost certainly prove to be inaccurate. It is, therefore, a waste of time to prepare them. Comment.
-
Metro builds and operates traditional shopping malls. It holds a $25 million deferred tax asset relating to credit carryforwards at the state, local, and Federal levels. No valuation allowances...
-
Explain why the marginal cost of production must increase if the marginal product of the variable resource is decreasing.
-
Give a specic example of data that might be gathered from each of the following business disciplines: accounting, finance, human resources, marketing, information systems, production, and management....
-
Identify the most appropriate approach and then design. Provide a rationale as to why this approach and design would be most appropriate. Develop a hypothetical research scenario that would...
-
The following cost data for the year just ended pertain to Heartstrings, Inc., a greeting card manufacturer: Service department costs * ............... $ 50,000 Direct labor: wages .....................
-
4. (7 Marks) ROVNO Ltd. just invested $65,000 into a new local network. Services provided by the network will bring $27,000 per year in the next five years. The following information is given: -...
-
Janice Morgan, age 24, is single and has no dependents. She is a freelance writer. In January 2021, Janice opened her own office located at 2751 Waldham Road, Pleasant Hill, NM 88135. She called her...
-
You have a job as the middle-level executive in a 250 bed hospital. The hospital is technically a non-profit hospital, but it is run as close to a for profit goal as possible. As a result of...
-
Your business arranges a short-term loan at the beginning of the winter quarter of $20,000 for three months (repayable in three months' time with interest charged at 1% per month). Question 1. What...
-
One diagonal of parallelogram is A(2,1) and C(-5,2) The other diagonal is B(-1,5) and D(-2,-2). Use the diagonals to determine whether the shape is a Parallelogram, Rectangle, Rhombus or Square.
-
On January 1, 2023, Blossom Corporation issued $801,000 of 5% bonds that are due in 11 years. The bonds were issued for $580,173 and pay interest each July 1 and January 1. The company uses the...
-
During 2015, A Company incurred research and development cost of P1,360,000 relating to a patent that was granted on July 1, 2015. Cost of registering the patent equaled P340,000. The patent legal...
-
A magnesium ion (Mg2+) traveling at 60 000 m/s enters a mass spectrometer with a magnetic field of 0.0800 T at an angle of 90 to the field. What is the radius of the curve followed by the magnesium...
-
A flood control project A will have a first cost of $1.4 million with an annual maintenance cost of $40,000 and a 10 year life. Reduced flood damage is expected to amount to $175,000 per year. Lost...
-
Provide a few individual examples who revealed what aspects of emotional intelligence?
-
An incumbent firm, Firm 1, faces a potential entrant, Firm 2 that has a lower marginal cost. The market demand curve is p = 120 q1 q2. Firm 1 has a constant marginal cost of $20, where Firm 2s is...
-
Ford invites Clarion to set up a plant at Fords industrial complex in Brazil, where Clarion will build navigation systems for installation in the Ford cars produced there. If Clarion builds the...
-
Given the estimated demand function Equation 2.2 for avocados, Q = 104 40p + 20pt + 0.01Y, use algebra (or calculus) to show how the demand curve shifts as per capita income, Y, increases by $ 1,000...
-
Methanol can be produced by the reaction of carbon dioxide and hydrogen as per the following reaction: The fresh feed available is 500 kmol/hr with 2% inerts and the rest being the reactants in...
-
In an instant coffee plant, 10000 kg/hr of coffee extract containing 20% solids is concentrated using a vacuum evaporator which is designed to produce a concentrated extract with 50% solids suitable...
-
The water gas shift reaction (WGSR) is the reaction of carbon monoxide with steam to produce carbon dioxide and hydrogen and it is used in the production of hydrogen for industrial applications. 600...

Study smarter with the SolutionInn App