

Question: You are evaluating a multi-location clothing retailer named Boom. Please make the following calculations. At the end, you will be asked to provide two strengths
You are evaluating a multi-location clothing retailer named Boom. Please make the following calculations. At the end, you will be asked to provide two strengths and two weaknesses for the company. For the weaknesses, you will be giving recommendations to improve each. You will be focusing on Year 5.
Year 5 customer data: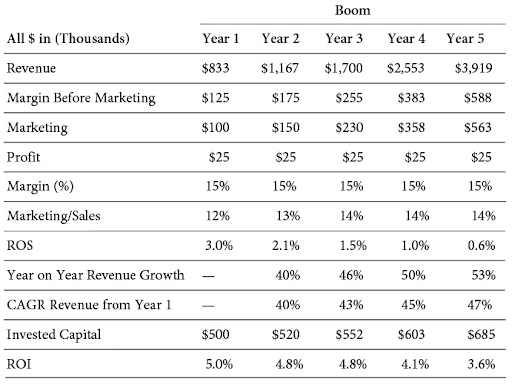
Here is some more information from Year 5.
| Industry Information | |
| Total Market Revenue | $35,493,000 |
| Total Market Units Sold | 280,000 |
| Population | 4,500,000 |
| Boom Information | |
| Units Sold | 47,568 |
| Discount Rate (per year) | 1% |
| Acquisition Spending | $270,500 |
| Baseline sales | $2,670,000 |
| Beginning Inventory | $2,600,000 |
| Ending Inventory | $2,750,000 |
Provide answers to the following questions. #1-15 require calculations, #16-18 require analysis.
Calculate:
-
Unit margin
-
Margin %
-
Breakeven volume in units
-
The target profit was $30,000. How many units short were they?
-
Market share?
-
Trial rate
-
Projected Year 6 penetration? They expect a 10% growth in new customers.
-
If they opened a new store in Year 5 that had $300,000 in revenues, what was their same store sales growth?
-
Average acquisition cost
-
Average retention cost
-
Inventory turns
-
Inventory days
-
Price premium
-
Lift
-
Cost of incremental sales
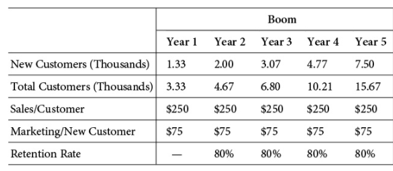
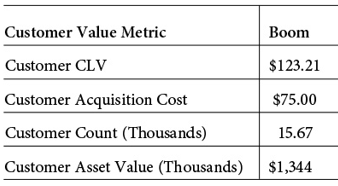
All $ in (Thousands) Year 1 $833 Year 2 $1,167 Boom Year 3 $1,700 Year 4 2,553 Year 5 $3,919 Revenue Margin Before Marketing Marketing Profit Margin (%) Marketing/Sales ROS $125 $100 $25 15% 12% 3.0% $175 $150 $25 15% 13% 2.1% $255 $230 $25 15% 14% 1.5% $383 $358 $25 15% 14% 1.0% $588 $563 $25 15% 14% 0.6% Year on Year Revenue Growth - 40% 46% 50% 53% CAGR Revenue from Year 1 Invested Capital - $500 40% $520 43% $552 45% $603 47% $685 ROI 5.0% 4.8% 4.8% 4.1% 3.6% 2 Year 1 New Customers (Thousands) 1.33 Total Customers (Thousands) 3.33 Sales/Customer $250 Marketing/New Customer $75 Retention Rate - Boom Year 2 Year 3 .00 3.07 4.676.80 $250 $250 $75 $75 80% 80% Year 4 4.77 10.21 $250 $75 80% Year 5 7.50 15.67 $250 $75 80% Customer Value Metric Boom Customer CLV $123.21 Customer Acquisition Cost $75.00 Customer Count (Thousands) 15.67 Customer Asset Value (Thousands) $1,344 All $ in (Thousands) Year 1 $833 Year 2 $1,167 Boom Year 3 $1,700 Year 4 2,553 Year 5 $3,919 Revenue Margin Before Marketing Marketing Profit Margin (%) Marketing/Sales ROS $125 $100 $25 15% 12% 3.0% $175 $150 $25 15% 13% 2.1% $255 $230 $25 15% 14% 1.5% $383 $358 $25 15% 14% 1.0% $588 $563 $25 15% 14% 0.6% Year on Year Revenue Growth - 40% 46% 50% 53% CAGR Revenue from Year 1 Invested Capital - $500 40% $520 43% $552 45% $603 47% $685 ROI 5.0% 4.8% 4.8% 4.1% 3.6% 2 Year 1 New Customers (Thousands) 1.33 Total Customers (Thousands) 3.33 Sales/Customer $250 Marketing/New Customer $75 Retention Rate - Boom Year 2 Year 3 .00 3.07 4.676.80 $250 $250 $75 $75 80% 80% Year 4 4.77 10.21 $250 $75 80% Year 5 7.50 15.67 $250 $75 80% Customer Value Metric Boom Customer CLV $123.21 Customer Acquisition Cost $75.00 Customer Count (Thousands) 15.67 Customer Asset Value (Thousands) $1,344
Step by Step Solution
There are 3 Steps involved in it

Get step-by-step solutions from verified subject matter experts