

Question: You are given the expected return, volatility and correlation matrix assumptions for seven asset classes. Your first task is to plot the minimum variance frontier
You are given the expected return, volatility and correlation matrix assumptions for seven asset classes. Your first task is to plot the minimum variance frontier -- that is the locus of portfolio combinations that have the minimum risk for a given level of expected return. Assume there is no short-selling; in other words, your portfolio weights cannot be negative. (Hint: You can choose the option in Excel solver to make non-constrained variables non-negative.)
How do you solve for the Global Minimum Variance weights?
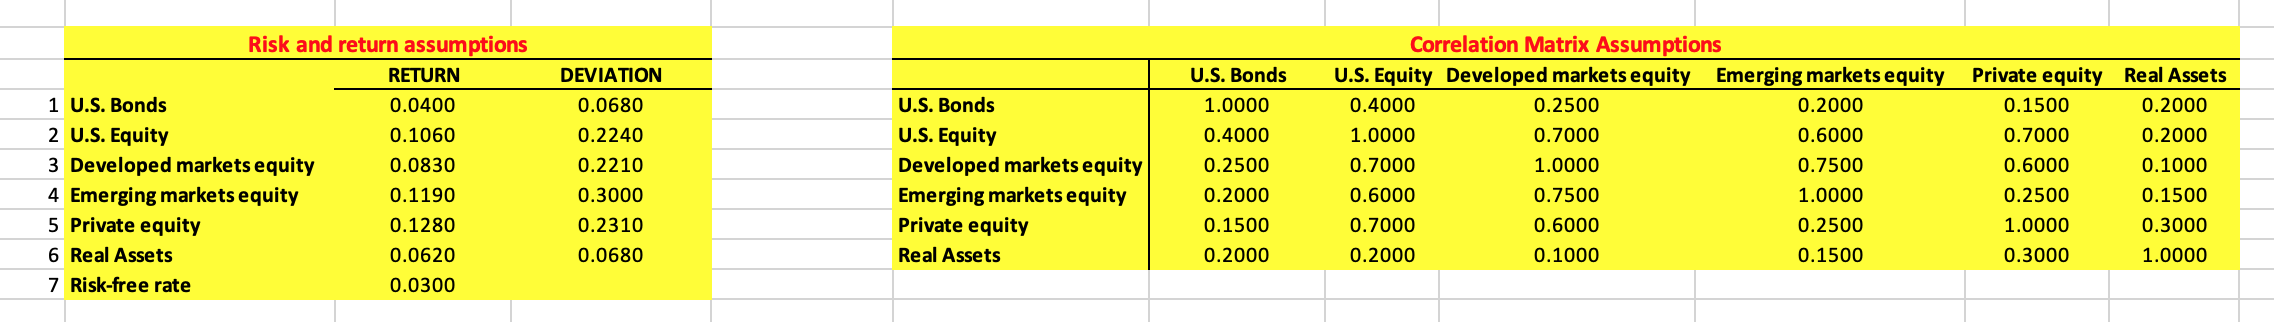
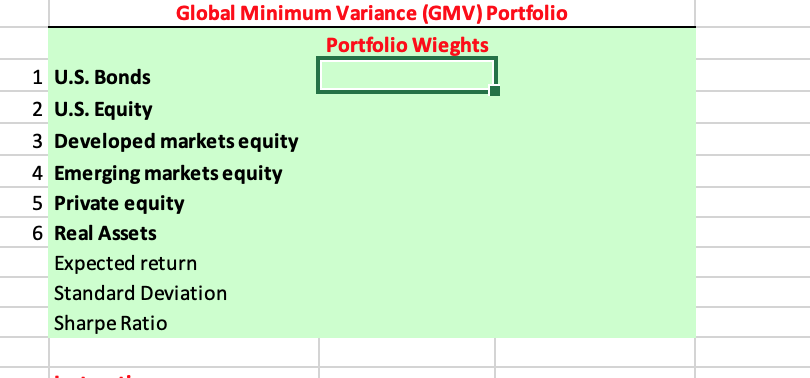
Risk and return assumptions RETURN 1 U.S. Bonds 0.0400 2 U.S. Equity 0.1060 3 Developed markets equity 0.0830 4 Emerging markets equity 0.1190 5 Private equity 0.1280 6 Real Assets 0.0620 7 Risk-free rate 0.0300 DEVIATION 0.0680 0.2240 0.2210 0.3000 0.2310 0.0680 U.S. Bonds U.S. Equity Developed markets equity| Emerging markets equity Private equity Real Assets U.S. Bonds 1.0000 0.4000 0.2500 0.2000 0.1500 0.2000 Correlation Matrix Assumptions U.S. Equity Developed markets equity Emerging markets equity 0.4000 0.2500 0.2000 1.0000 0.7000 0.6000 0.7000 1.0000 0.7500 0.6000 0.7500 1.0000 0.7000 0.6000 0.2500 0.2000 0.1000 0.1500 Private equity Real Assets 0.1500 0.2000 0.7000 0.2000 0.6000 0.1000 0.2500 0.1500 1.0000 0.3000 0.3000 1.0000 Global Minimum Variance (GMV) Portfolio Portfolio Wieghts 1 U.S. Bonds 2 U.S. Equity 3 Developed markets equity 4 Emerging markets equity 5 Private equity 6 Real Assets Expected return Standard Deviation Sharpe Ratio Risk and return assumptions RETURN 1 U.S. Bonds 0.0400 2 U.S. Equity 0.1060 3 Developed markets equity 0.0830 4 Emerging markets equity 0.1190 5 Private equity 0.1280 6 Real Assets 0.0620 7 Risk-free rate 0.0300 DEVIATION 0.0680 0.2240 0.2210 0.3000 0.2310 0.0680 U.S. Bonds U.S. Equity Developed markets equity| Emerging markets equity Private equity Real Assets U.S. Bonds 1.0000 0.4000 0.2500 0.2000 0.1500 0.2000 Correlation Matrix Assumptions U.S. Equity Developed markets equity Emerging markets equity 0.4000 0.2500 0.2000 1.0000 0.7000 0.6000 0.7000 1.0000 0.7500 0.6000 0.7500 1.0000 0.7000 0.6000 0.2500 0.2000 0.1000 0.1500 Private equity Real Assets 0.1500 0.2000 0.7000 0.2000 0.6000 0.1000 0.2500 0.1500 1.0000 0.3000 0.3000 1.0000 Global Minimum Variance (GMV) Portfolio Portfolio Wieghts 1 U.S. Bonds 2 U.S. Equity 3 Developed markets equity 4 Emerging markets equity 5 Private equity 6 Real Assets Expected return Standard Deviation Sharpe Ratio
Step by Step Solution
There are 3 Steps involved in it

Get step-by-step solutions from verified subject matter experts