

Question: You are provided data containing relationship between Temperature (F) and Resistance (22) for a NTC (remember what NTC stands for?) thermistor that you would
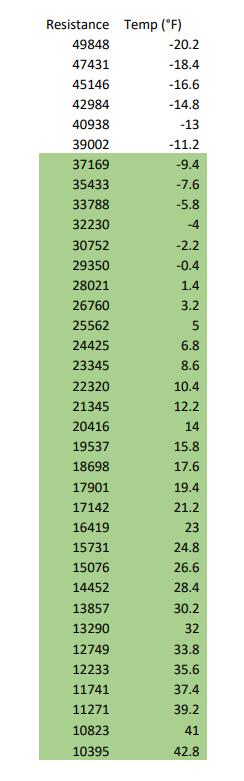
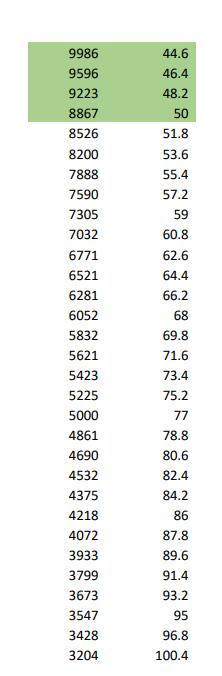
You are provided data containing relationship between Temperature (F) and Resistance (22) for a NTC (remember what NTC stands for?) thermistor that you would like to use in a new line of refrigerators your company is designing. This line of refrigerators will, of course be an loT (Internet of Things) in that it will notify the user on his/her cell phone if the temperature of the freezer rises above 15F (typically freezers should be in the range of -3F - 0F), indicating some type of malfunction. Resistance Temp (F) 49848 47431 45146 42984 40938 39002 37169 35433 33788 32230 30752 29350 28021 26760 25562 24425 23345 22320 21345 20416 19537 18698 17901 17142 16419 15731 15076 14452 13857 13290 12749 12233 11741 11271 10823 10395 -20.2 -18.4 -16.6 -14.8 -13 -11.2 -9.4 -7.6 -5.8 -4 -2.2 -0.4 1.4 3.2 5 6.8 8.6 10.4 12.2 14 15.8 17.6 19.4 21.2 23 24.8 26.6 28.4 30.2 32 33.8 35.6 37.4 39.2 41 42.8 9986 9596 9223 8867 8526 8200 7888 7590 7305 7032 6771 6521 6281 6052 5832 5621 5423 5225 5000 4861 4690 4532 4375 4218 4072 3933 3799 3673 3547 3428 3204 44.6 46.4 48.2 50 51.8 53.6 55.4 57.2 59 60.8 62.6 64.4 66.2 68 69.8 71.6 73.4 75.2 77 78.8 80.6 82.4 84.2 86 87.8 89.6 91.4 93.2 95 96.8 100.4 a. (15 pts) Copy the data above into a .csv file, load/open it and then remember to save it as a separate .xlsx file for work (if using Excel). Plot the data to make sure it looks OK. Create linear regression fit and plot it. Well, that doesn't work. Looks like we need to go to higher ordered equations. b. (20 pts) Create a quadratic (y=a+bx+cx) equation fit of the data and plot the equation on the graph created in (a.). We wish the error in temperature for the range of (-10F -50F) to be < 2F. If a quadratic equation won't meet this specification, continue to increase the power (cubic, 4th power, . ..) until it does.
Step by Step Solution
3.59 Rating (153 Votes )
There are 3 Steps involved in it
Based on the given data it seems to be a table with four columns The first column appears to be a se... View full answer

Get step-by-step solutions from verified subject matter experts