

You are working for a marketing consultancy, who have been asked by Netflix to attempt to find
Question:
You are working for a marketing consultancy, who have been asked by Netflix to attempt to find ways to increase their total number of subscribers.
You have just returned from a presentation where your team leader presented a regression they had run on some data they had found online.
Your team leader had estimated the linear model:
netflixt = β0 + β1Bookst + et (1)
where netflixt is the total number of Netflix subscribers in period t and Bookst is an index of the volume of sales of books, periodicals and magazines in period t, compiled by the Office for National Statistics.
Your team leader presented the graphs and regression output, below, as part of their presentation.
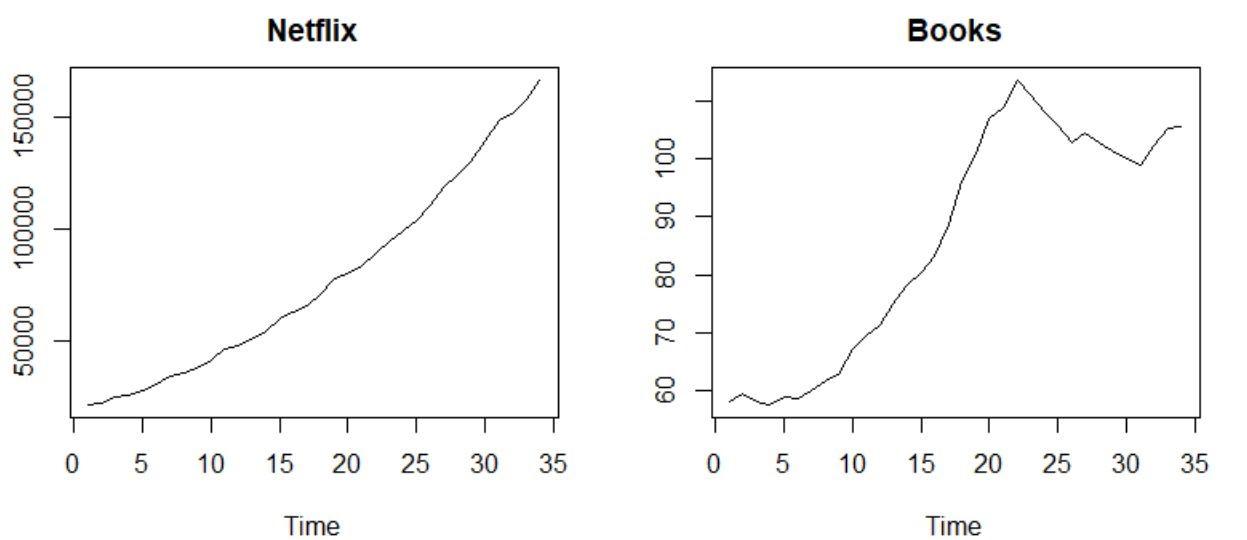
Call: lm(formula = data$Netflix ~ data$Books)
Residuals:
Min 1Q Median 3Q Max
-39702 -9956 -1357 4335 53309
Coefficients:
Estimate Std. Error t value Pr(>|t|)
(Intercept) -82287.9 18522.0 -4.443 9.95e-05 *** data$Books 1858.9 209.9 8.855 4.07e-10 ***
---
Signif. codes: 0 ‘***’ 0.001 ‘**’ 0.01 ‘*’ 0.05 ‘.’ 0.1 ‘ ’ 1
Residual standard error: 24300 on 32 degrees of freedom Multiple R-squared: 0.7102,Adjusted R-squared: 0.7011
F-statistic: 78.41 on 1 and 32 DF, p-value: 4.069e-10
At the end of the meeting your team leader said that they were going to recommend that Netflix follow the strategy of promoting reading, as this will cause their subscription numbers to grow. The rest of your team, who have not studied econometrics, agree with your team leader’s suggestion.
You now need to draft a memo for your team which identifies and explains why this regression might be spurious and what you might be able to do to make the results more reliable for use in the context given.
Expert Answer:
The given regression equation is spurious regression because the but the variable are non stationary variable Also we see that both the variables are mutually independent random walk Also we see that ... View the full answer


Financial Accounting
ISBN: 978-1259103285
5th Canadian edition
Authors: Robert Libby, Patricia Libby, Daniel Short, George Kanaan, M
