

Question: You conduct a regression in R using the following code and receive the following output. Which best describes the effect of the elearning training on
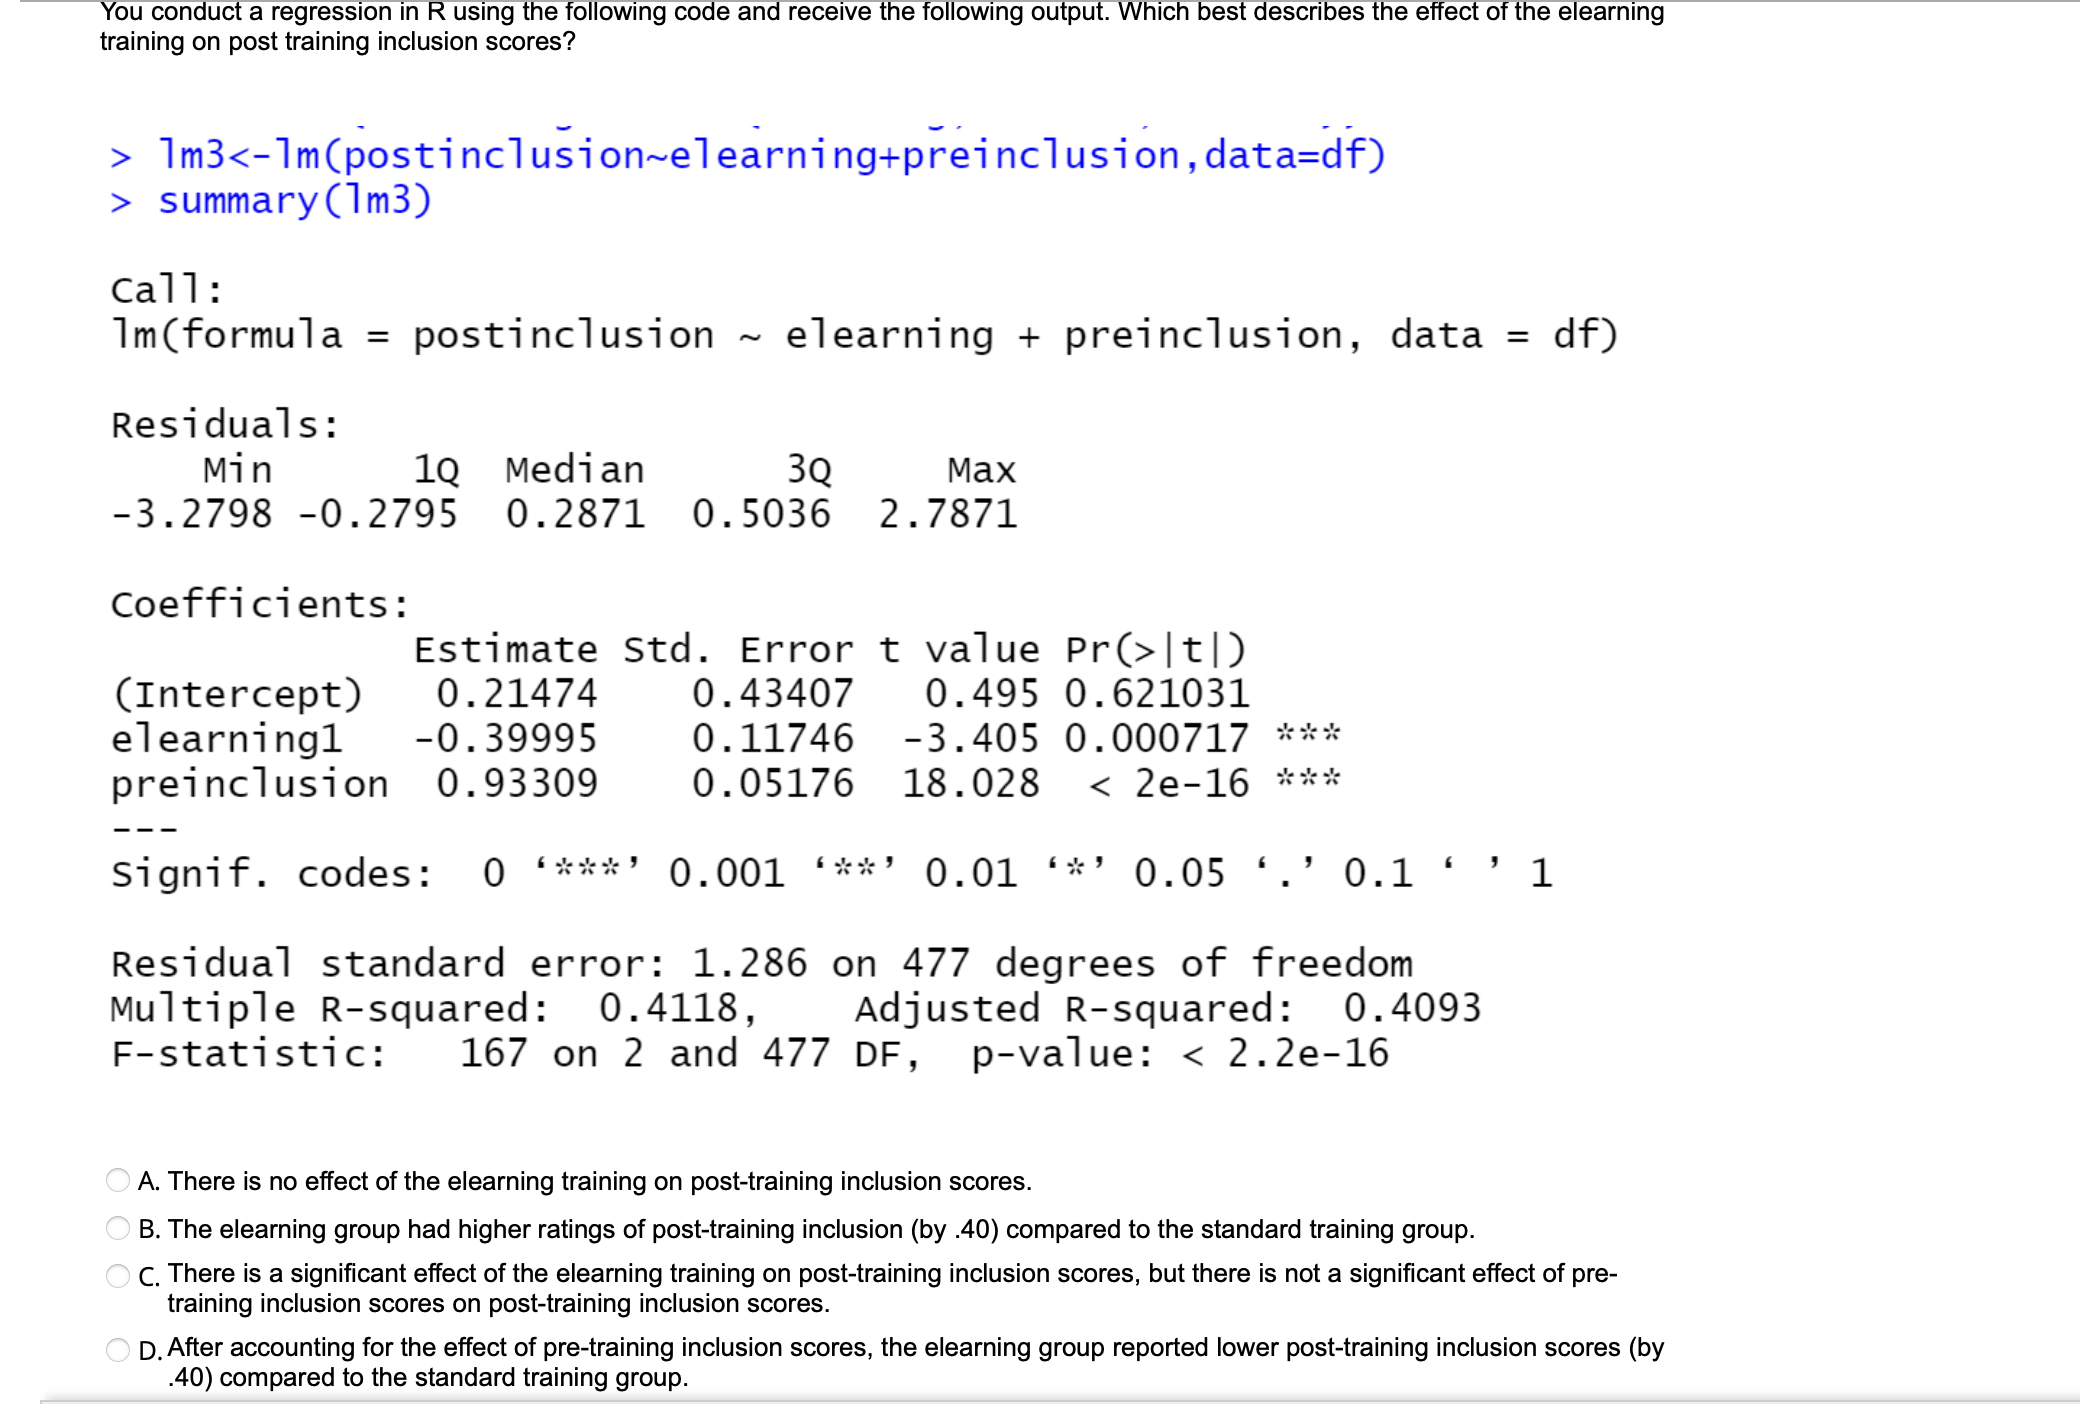


You conduct a regression in R using the following code and receive the following output. Which best describes the effect of the elearning training on post training inclusion scores? > 1m3 summary (1m3) Call : 1m(formula = postinclusion ~ elearning + preinclusion, data = df) Residuals : Min 1Q Median 3Q Max -3.2798 -0. 2795 0. 2871 0. 5036 2.7871 Coefficients : Estimate Std. Error t value Pr(> |t|) (Intercept) 0. 21474 0. 43407 0. 495 0. 621031 elearning1 -0. 39995 0. 11746 -3. 405 0. 000717 * * * preinclusion 0. 93309 0. 05176 18.028
Step by Step Solution
There are 3 Steps involved in it
1 Expert Approved Answer
Step: 1 Unlock

Question Has Been Solved by an Expert!
Get step-by-step solutions from verified subject matter experts
Step: 2 Unlock
Step: 3 Unlock