

Question: You do not need to perform these calculations yourself. Various reputable websites have these ratios already calculated and available to the public saving you a
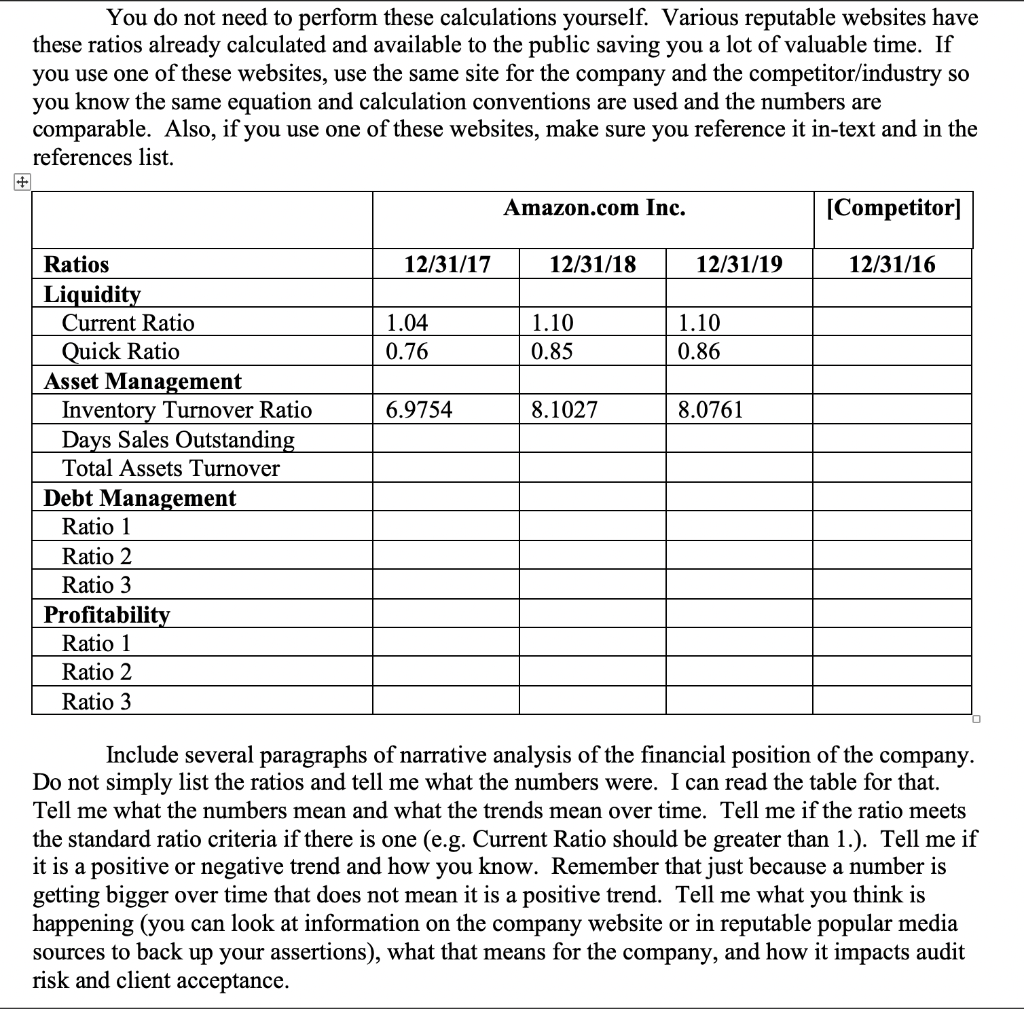
You do not need to perform these calculations yourself. Various reputable websites have these ratios already calculated and available to the public saving you a lot of valuable time. If you use one of these websites, use the same site for the company and the competitor/industry so you know the same equation and calculation conventions are used and the numbers are comparable. Also, if you use one of these websites, make sure you reference it in-text and in the references list. Amazon.com Inc. [Competitor) 12/31/17 12/31/18 12/31/19 12/31/16 1.04 0.76 1.10 0.85 1.10 0.86 6.9754 8.1027 8.0761 Ratios Liquidity Current Ratio Quick Ratio Asset Management Inventory Turnover Ratio Days Sales Outstanding Total Assets Turnover Debt Management Ratio 1 Ratio 2 Ratio 3 Profitability Ratio 1 Ratio 2 Ratio 3 Include several paragraphs of narrative analysis of the financial position of the company. Do not simply list the ratios and tell me what the numbers were. I can read the table for that. Tell me what the numbers mean and what the trends mean over time. Tell me if the ratio meets the standard ratio criteria if there is one (e.g. Current Ratio should be greater than 1.). Tell me if it is a positive or negative trend and how you know. Remember that just because a number is getting bigger over time that does not mean it is a positive trend. Tell me what you think is happening (you can look at information on the company website or in reputable popular media sources to back up your assertions), what that means for the company, and how it impacts audit risk and client acceptance. You do not need to perform these calculations yourself. Various reputable websites have these ratios already calculated and available to the public saving you a lot of valuable time. If you use one of these websites, use the same site for the company and the competitor/industry so you know the same equation and calculation conventions are used and the numbers are comparable. Also, if you use one of these websites, make sure you reference it in-text and in the references list. Amazon.com Inc. [Competitor) 12/31/17 12/31/18 12/31/19 12/31/16 1.04 0.76 1.10 0.85 1.10 0.86 6.9754 8.1027 8.0761 Ratios Liquidity Current Ratio Quick Ratio Asset Management Inventory Turnover Ratio Days Sales Outstanding Total Assets Turnover Debt Management Ratio 1 Ratio 2 Ratio 3 Profitability Ratio 1 Ratio 2 Ratio 3 Include several paragraphs of narrative analysis of the financial position of the company. Do not simply list the ratios and tell me what the numbers were. I can read the table for that. Tell me what the numbers mean and what the trends mean over time. Tell me if the ratio meets the standard ratio criteria if there is one (e.g. Current Ratio should be greater than 1.). Tell me if it is a positive or negative trend and how you know. Remember that just because a number is getting bigger over time that does not mean it is a positive trend. Tell me what you think is happening (you can look at information on the company website or in reputable popular media sources to back up your assertions), what that means for the company, and how it impacts audit risk and client acceptance
Step by Step Solution
There are 3 Steps involved in it

Get step-by-step solutions from verified subject matter experts