

Question: You have an assembly process that yields a final dimension that is to be controlled. The target value for this dimension is 7 5 mm
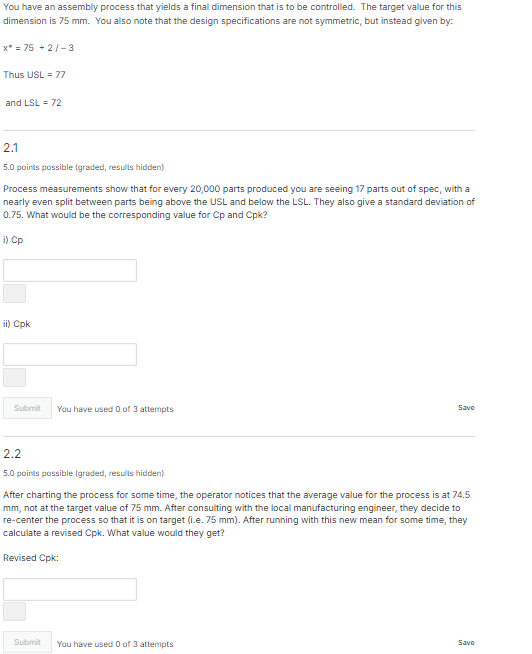
You have an assembly process that yields a final dimension that is to be controlled. The target value for this dimension is mm You also note that the design specifications are not symmetric, but instead given by:
mathrmx
Thus USL
and mathrmLSL
points possible graded results hidden
Process measurements show that for every parts produced you are seeing parts out of spec, with a nearly even split between parts being above the USL and below the LSL They also give a standard deviation of What would be the corresponding value for Cp and Cpk
i Cp
ii Cpk
points possible graded results hidden
After charting the process for some time, the operator notices that the average value for the process is at mm not at the target value of mm After consulting with the local manufacturing engineer, they decide to recenter the process so that it is on target ie mm After running with this new mean for some time, they calculate a revised Cpk What value would they get?
Revised Cpk:
points possible graded results hidden
After this change, how many parts would we expect to be out of spec in a lot of parts? Round the nearest part number, ie don't report any decimals
You have used of attempts
points possible graded results hidden
Now you come along and tell them to use the Quality Loss Function to quantify this problem instead of Cpk Compare the expected quality loss for the mean being centered on the target value vs being centered for symmetric limits
NB: you can assume that the cost of being above and below the mean is the same and that the calibration constant for EL is
mathrmEmathrmL if centered at mm spec limits are symmetric about mean:
points possible graded results hidden
mathrmEmathrmL if centered at mm mean is centered on target value:
Step by Step Solution
There are 3 Steps involved in it
1 Expert Approved Answer
Step: 1 Unlock

To solve the problem we will calculate the Cp and Cpk values with the given data and then analyze the situation after the process is recentered Step 1 ... View full answer
Question Has Been Solved by an Expert!
Get step-by-step solutions from verified subject matter experts
Step: 2 Unlock
Step: 3 Unlock