

Question: You may need to use the appropriate technology to answer this question. DJIA and the S&P 500 for 15 weeks of a certain year follow.
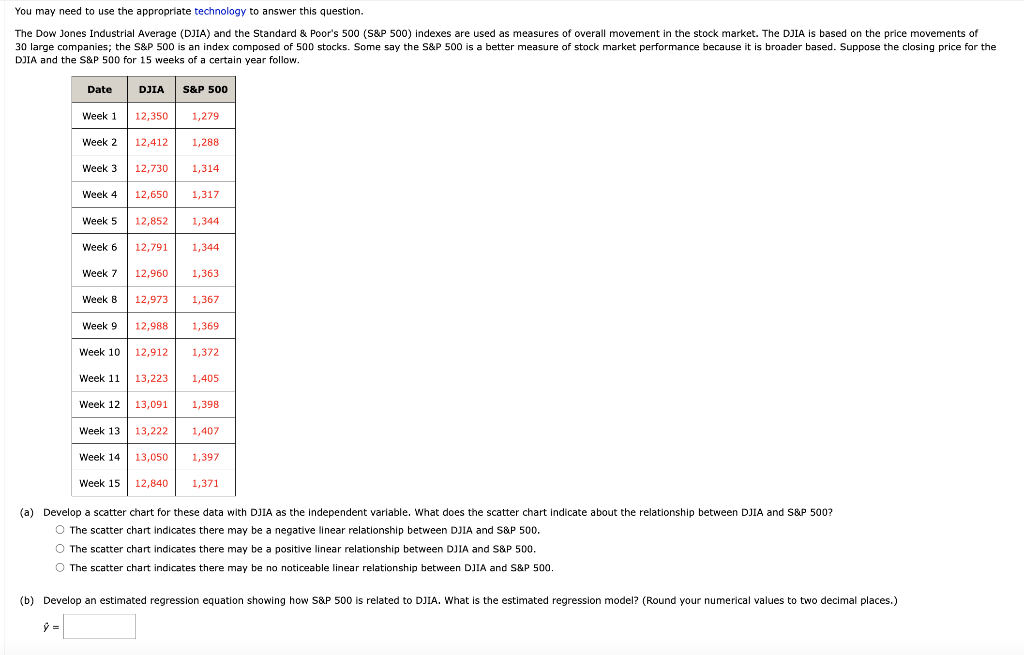
You may need to use the appropriate technology to answer this question. DJIA and the S\&P 500 for 15 weeks of a certain year follow. \begin{tabular}{l|l|l|} Week 15 & 12,840 & 1,371 \end{tabular} (a) Develop a scatter chart for these data with DJIA as the independent variable. What does the scatter chart indicate about the relationship between DJIA and S\&P 500 ? The scatter chart indicates there may be a negative linear relationship between DJIA and SaP 500. The scatter chart indicates there may be a positive linear relationship between DJIA and S\&P 500. The scatter chart indicates there may be no noticeable linear relationship between DJIA and S\&P 500. (c) What is the 95% confidence interval for the regression parameter 1 ? (Round your answers to three decimal places.) to Based on this interval, what conclusion can you make about the hypotheses that the regression parameter 1 is equal to zero? Because this interval include zero, we the hypothesis that 1=0. (d) How much of the variation in the sample values of S\&P 500 (in \%) does the model estimated in part (b) explain? (Round your answer to two decimal places.) % (e) Suppose that the closing price for the DJIA is 13,600. Estimate the closing price for the S\&P 500. (Round your answer to the nearest integer.)
Step by Step Solution
There are 3 Steps involved in it

Get step-by-step solutions from verified subject matter experts