

Question: You may need to use the appropriate technology to answer this question. The following data represent a company's yearly sales and its advertising expenditure
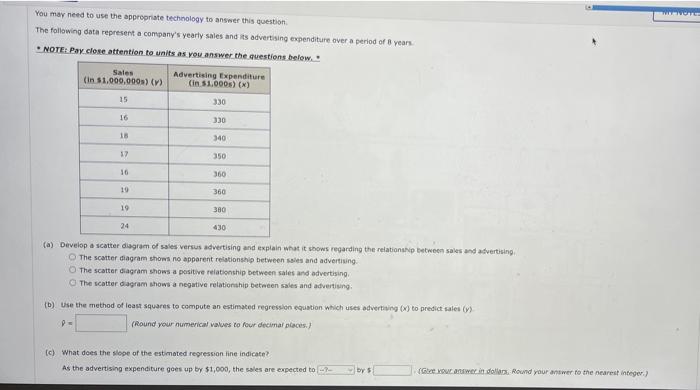
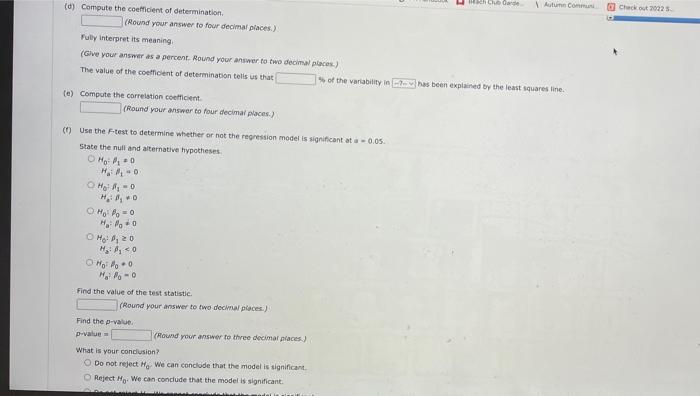
You may need to use the appropriate technology to answer this question. The following data represent a company's yearly sales and its advertising expenditure over a period of 8 years NOTE: Pay close attention to units as you answer the questions below. Sales (in $1,000,000s) (v) 15 16 18 16 19 19 24 Advertising Expenditure (in $1.000s) (x) 330 330 340 350 360 360 380 430 (a) Develop a scatter diagram of sales versus advertising and explain what it shows regarding the relationship between sales and advertising. The scatter diagram shows no apparent relationship between sales and advertising. O The scatter diagram shows a positive relationship between sales and advertising. The scatter diagram shows a negative relationship between sales and advertising. (b) Use the method of least squares to compute an estimated regression equation which uses advertising (x) to predict sales (y) P= (Round your numerical values to four decimal places) (c) What does the slope of the estimated regression line indicate? As the advertising expenditure goes up by $1,000, the sales are expected to by s (Give your answer in dollars, Round your answer to the nearest integer.) THE TOTES (d) Compute the coefficient of determination. (Round your answer to four decimal places) Fully interpret its meaning. (Give your answer as a percent. Round your answer to two decimal places) The value of the coefficient of determination tells us that (e) Compute the correlation coefficient. (Round your answer to four decimal places) (f) Use the F-test to determine whether or not the regression model is significant at a -0.05. State the null and alternative hypotheses. HO:0 H: 0 H:=0 H: 0 Ho: Po=0 H:0 Hg By zo H: A
Step by Step Solution
3.49 Rating (156 Votes )
There are 3 Steps involved in it
To analyze the given data set representing a companys yearly sales and advertising expenditure we will perform the following calculations and statisti... View full answer

Get step-by-step solutions from verified subject matter experts