

Question: You need to calculate funal grades for the professor, using the following guidelines: 1. This class uses weighting, which you will need to account for
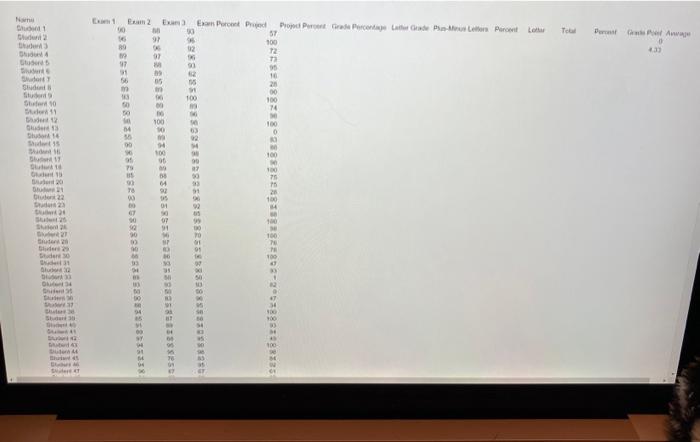
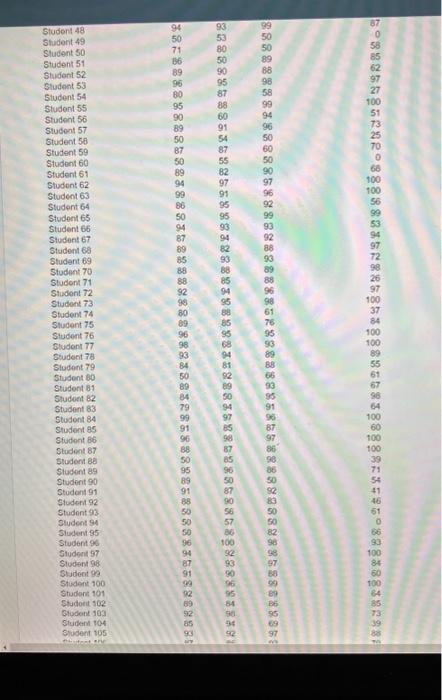
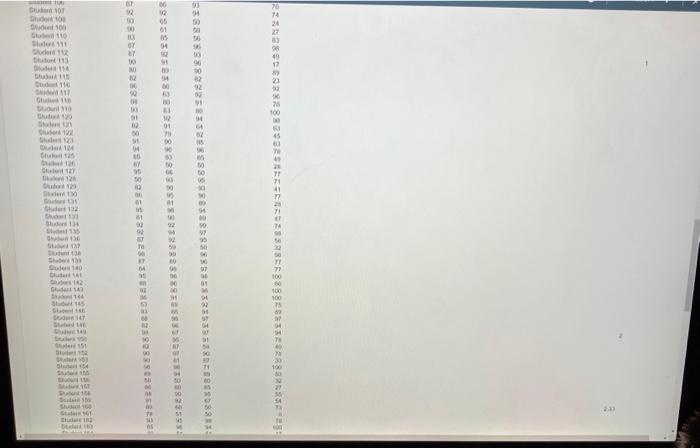
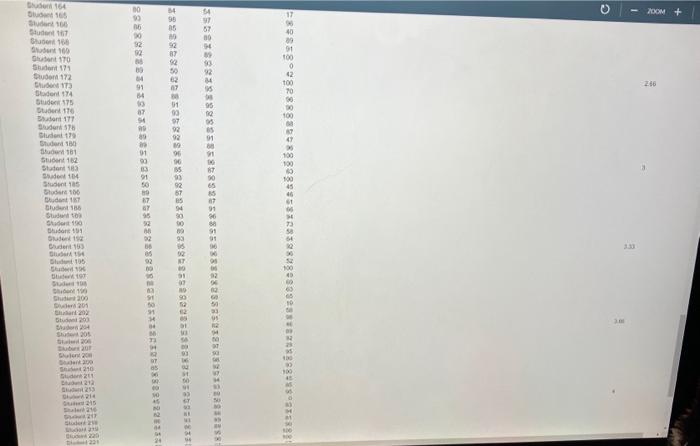
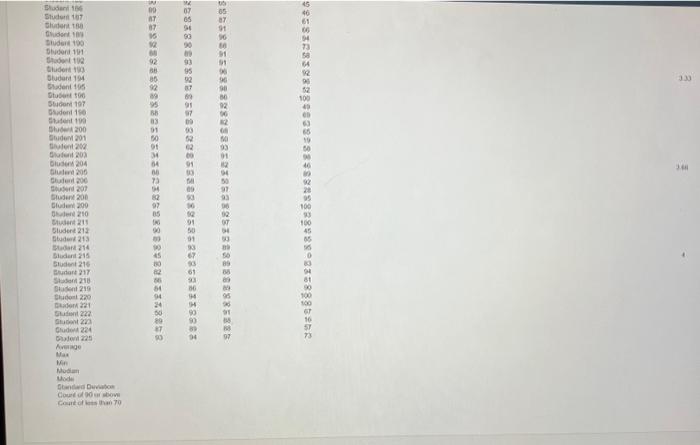
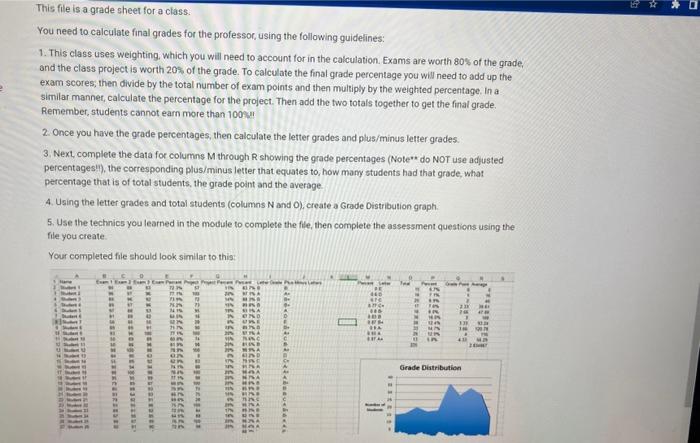
You need to calculate funal grades for the professor, using the following guidelines: 1. This class uses weighting, which you will need to account for in the calculation. Exams are worth 80% of the grade. and the class project is worth 205 of the grade. To calculate the final grade percentage you will need to add up the exam scores; then divide by the total number of exam points and then multiply by the weighted percentage. In a similar mannet, calculate the percentage for the project. Then add the two totals together to get the final grade. Remember, students cannot earn more than 100s I 2. Once you have the grade percentages, then calculate the letter grades and plus/minus letter grades. 3. Next, complete the data for columns M through R showing the grade percentages (Note* do NOT use adjusted percentagesil), the corresponding plusiminus letter that equates to, how many students had that grade, what percentage that is of total students, the grade point and the average. 4. Using the letter grades and total students (columns N and O) create a Grade Distribution graph. 5. Use the technics you learned in the modile to complete the file, then complete the assessment questions using the file you create Your completed file should look simllar to this: What is the grade point for a C? You need to calculate funal grades for the professor, using the following guidelines: 1. This class uses weighting, which you will need to account for in the calculation. Exams are worth 80% of the grade. and the class project is worth 205 of the grade. To calculate the final grade percentage you will need to add up the exam scores; then divide by the total number of exam points and then multiply by the weighted percentage. In a similar mannet, calculate the percentage for the project. Then add the two totals together to get the final grade. Remember, students cannot earn more than 100s I 2. Once you have the grade percentages, then calculate the letter grades and plus/minus letter grades. 3. Next, complete the data for columns M through R showing the grade percentages (Note* do NOT use adjusted percentagesil), the corresponding plusiminus letter that equates to, how many students had that grade, what percentage that is of total students, the grade point and the average. 4. Using the letter grades and total students (columns N and O) create a Grade Distribution graph. 5. Use the technics you learned in the modile to complete the file, then complete the assessment questions using the file you create Your completed file should look simllar to this: What is the grade point for a C
Step by Step Solution
There are 3 Steps involved in it

Get step-by-step solutions from verified subject matter experts