

Question: You want to develop an $R$-chart. You know the average range is 5 based on 8 samples of size 10 . What is the resulting
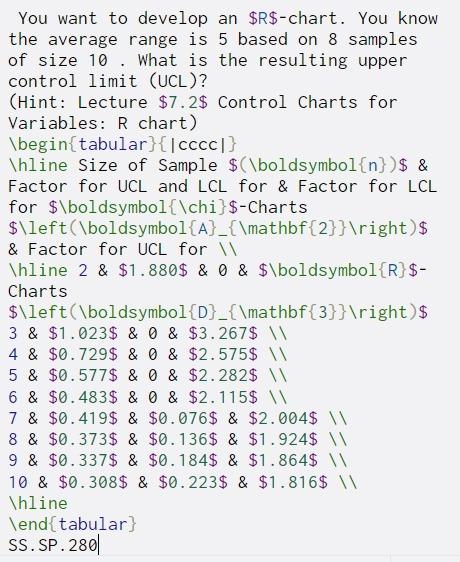
You want to develop an $R$-chart. You know the average range is 5 based on 8 samples of size 10 . What is the resulting upper control limit (UCL)? (Hint: Lecture $7.2$ Control Charts for Variables: R chart) \begin{tabular}{cccc} Thline Size of Sample $(\boldsymbol{n})$ & Factor for UCL and LCL for & Factor for LCL for $\boldsymbol{\chi}$-Charts $\left(\boldsymbol{A} _{\mathbf{2}} ight)$ & Factor for UCL for \hline 2 & $1.880$ & 0 & $\boldsymbol{R}$- Charts $\left(\boldsymbol{D} _{\mathbf{3}} ight) $ 3 & $1.023$ & 0 & $3.267$ 4 & $0.729$ & 0 & $2.575$ W 5 & $0.577$ & 0 & $2.282$ 6 & $0.483$ & 0 & $2.115$ 7 & $0.419$ & $0.076$ & $2.004$ 8 & $0.373$ & $0.136$ & $1.924$ 9 & $0.337$ & $0.184$ & $1.864$ 10 & $0.308$ & $0.223$ & $1.816$ W \hline \end{tabular) SS.SP.2801
Step by Step Solution
There are 3 Steps involved in it

Get step-by-step solutions from verified subject matter experts