

Question: You wanted to improve the model from question two and have decided to include a new variable, percentage of English learners (EL PCT). SUMMARY OUTPUT
You wanted to improve the model from question two and have decided to include a new variable, percentage of English learners (EL PCT).
SUMMARY OUTPUT
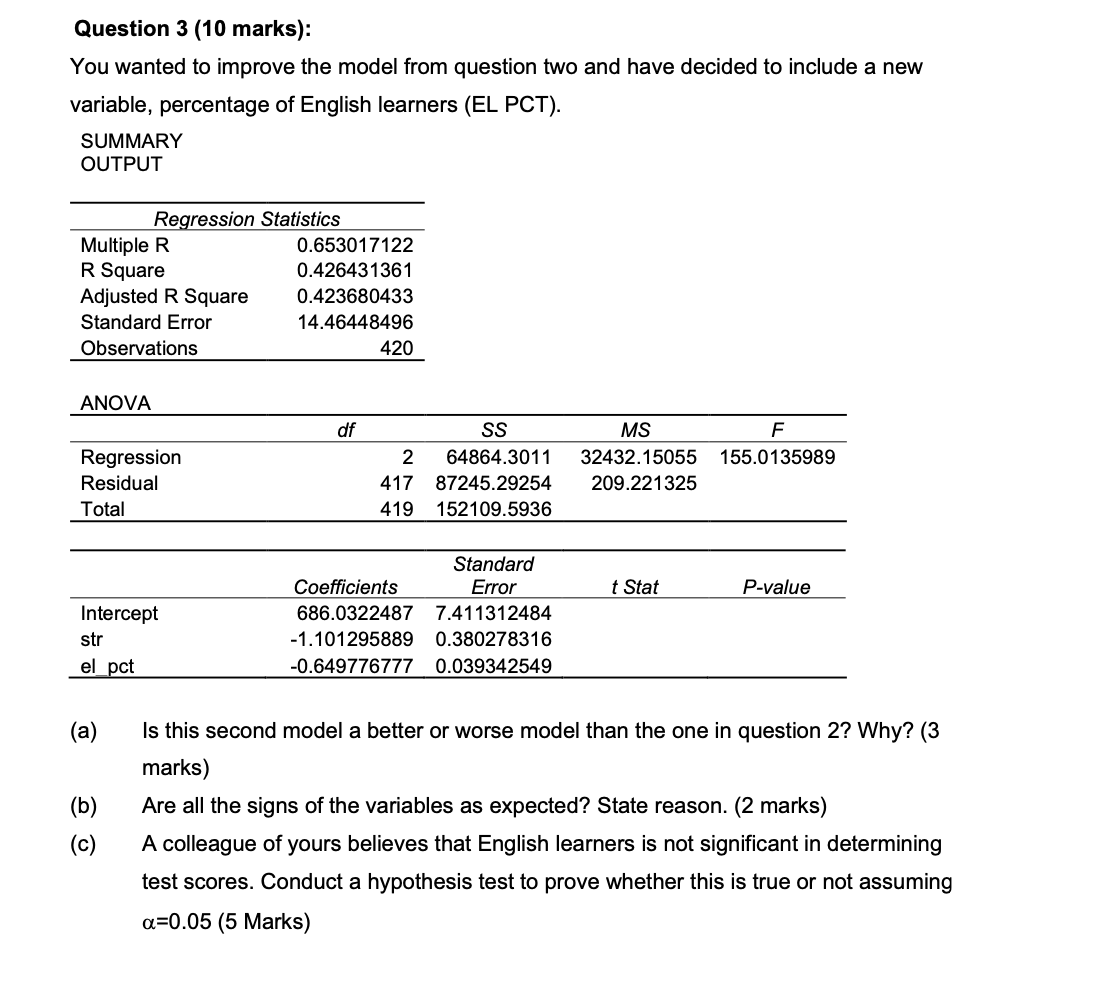
Question 3 (10 marks): You wanted to improve the model from question two and have decided to include a new variable, percentage of English learners (EL PCT). SUMMARY OUTPUT Regression Statistics Multiple R 0653017122 R Square 0.426431361 Adjusted R Square 0.423680433 Standard Error 14.46448496 Observations 420 ANOVA df 88 MS F Regression 2 64864.301 1 32432.15055 155.0135989 Residual 41? 8724529254 209.221 325 Total 419 152109.5936 Standard Coefficients Error t Stat Pvalue Intercept 686032248? 7.41 1312484 str -1.101295889 0.380278316 el pct 0649776??? 003934254!) (a) Is this second model a better or worse model than the one in question 2? Why? (3 marks) (b) Are all the signs of the variables as expected? State reason. (2 marks) (0) A colleague of yours believes that English learners is not significant in determining test scores. Conduct a hypothesis test to prove whether this is true or not assuming o=0.05
Step by Step Solution
There are 3 Steps involved in it

Get step-by-step solutions from verified subject matter experts