

Question: Your Task Use the Excel file (DT4-1.xlsx) to execute the following analyses: 1. Calculate the amount of sales by the experimental condition. (Recall that this
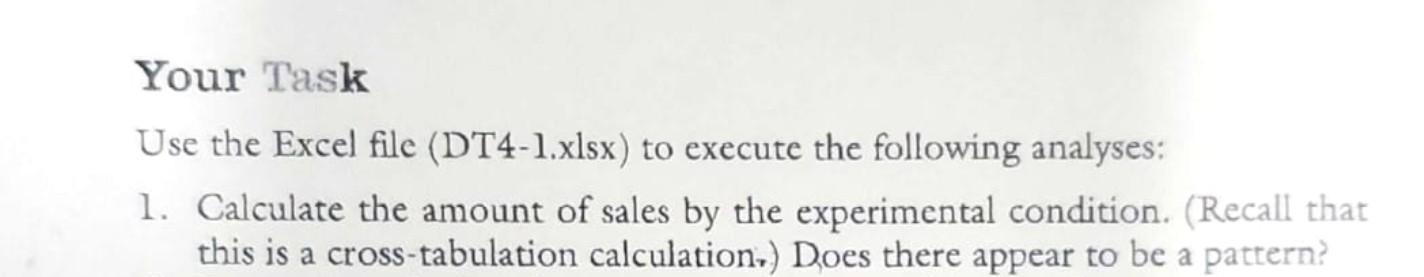
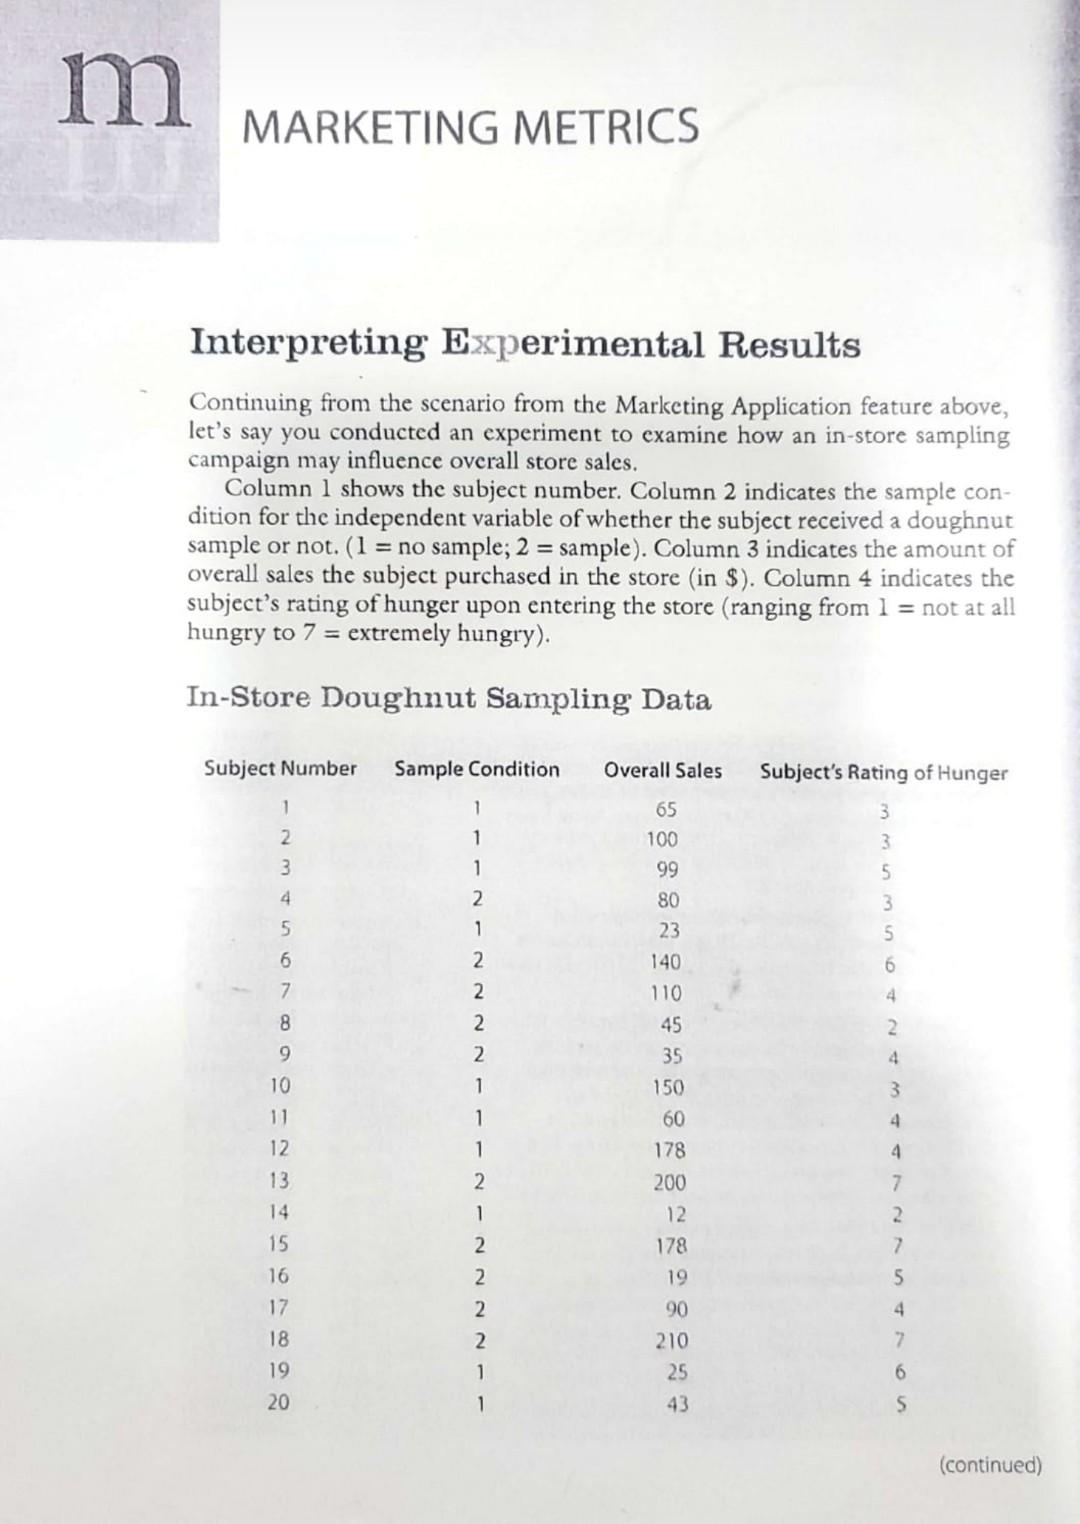
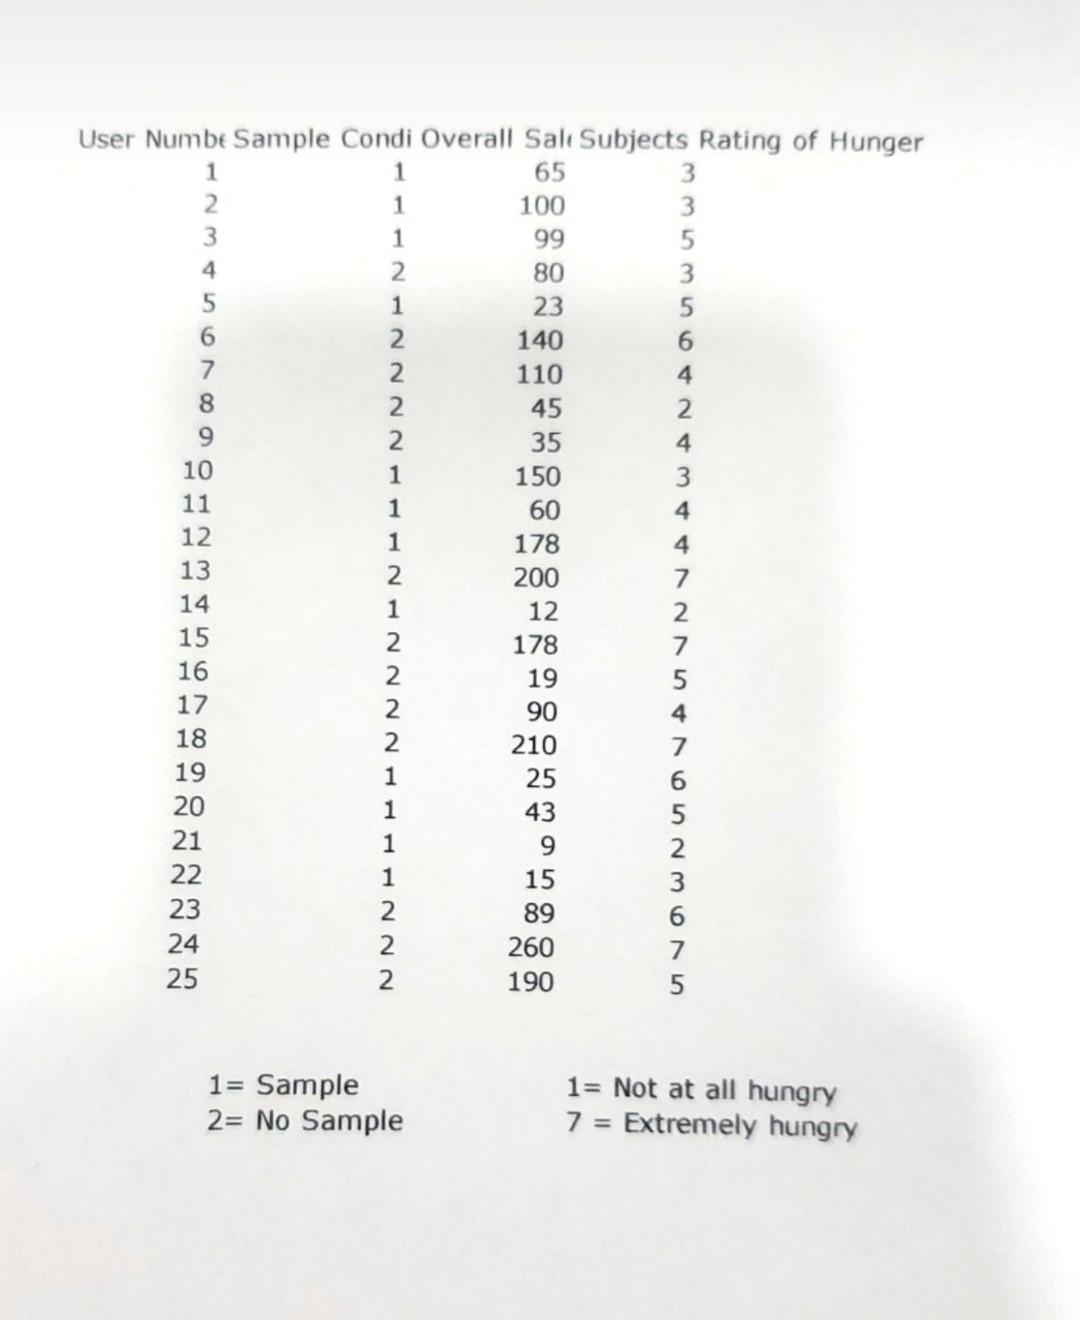
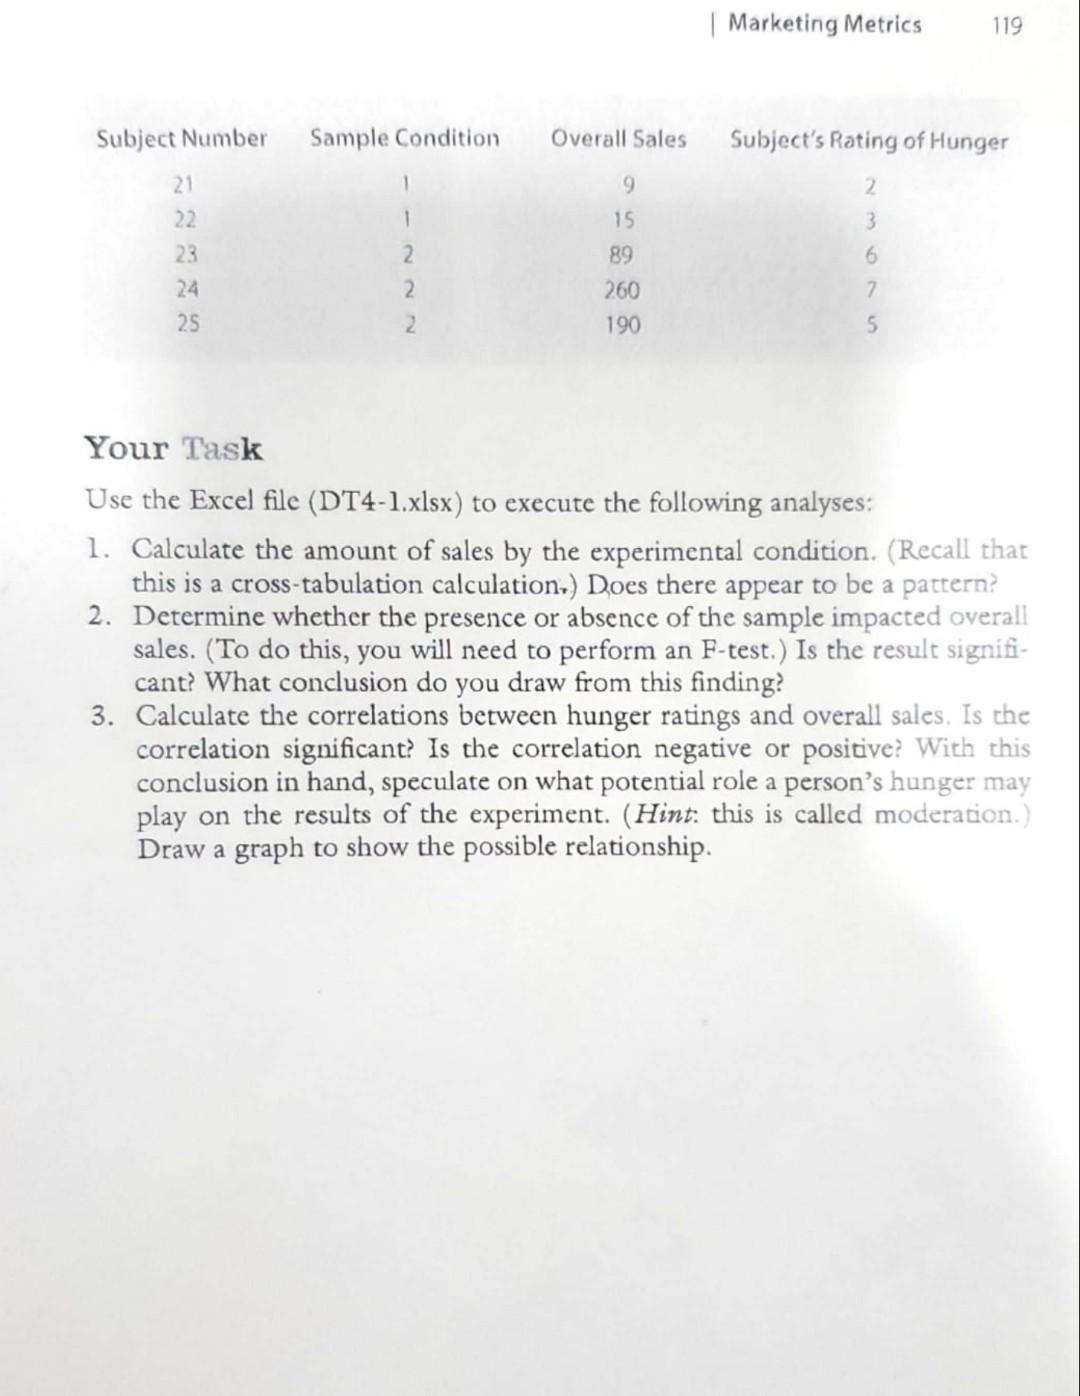
Your Task Use the Excel file (DT4-1.xlsx) to execute the following analyses: 1. Calculate the amount of sales by the experimental condition. (Recall that this is a cross-tabulation calculation.) Does there appear to be a pattern? m MARKETING METRICS Interpreting Experimental Results Continuing from the scenario from the Marketing Application feature above, let's say you conducted an experiment to examine how an in-store sampling campaign may influence overall store sale Column 1 shows the subject number. Column 2 indicates the sample con- dition for the independent variable of whether the subject received a doughnut sample or not. (1 = no sample; 2 = sample). Column 3 indicates the amount of overall sales the subject purchased in the store (in $). Column 4 indicates the subject's rating of hunger upon entering the store (ranging from 1 = not at all hungry to 7 = extremely hungry). In-Store Doughnut Sampling Data Subject Number Sample Condition Overall Sales Subject's Rating of Hunger 1 1 3 2 1 3 3 5 1 2 3 4 5 5 65 100 99 80 23 140 110 45 35 150 1 2 2 6 7 6 4 8 2 2 9 2 4 1 3 1 4 10 11 12 13 14 1 60 178 200 12 178 4 7 2 1 2 2 7 2 5 15 16 17 18 19 90 210 25 43 2 2. 1 1 4 2 19 20 6 S (continued) User Numbe Sample Condi Overall Sale Subjects Rating of Hunger 1 1 65 3 2 1 100 3 3 1 99 5 2 80 3 5 1 23 5 6 2 140 6 7 2 110 4. 8 2 45 2 9 2 35 4 10 1 150 3 11 1 60 4 12 1 178 4 13 2 200 7 14 1 12 2 15 2 178 7 16 2 19 5 17 90 4 18 2 210 19 1 25 20 1 43 5 21 1 9 2 22 15 23 2 89 6 24 2. 260 7 25 2 190 u vo WNUOVANA 1= Sample 2= No Sample 1= Not at all hungry 7 = Extremely hungry | Marketing Metrics 119 Subject Number Sample Condition Overall Sales Subject's Rating of Hunger 1 9 2 1 15 3 21 22 23 24 2 2 2 89 260 190 6 7 5 25 Your Task Use the Excel file (DT4-1.xlsx) to execute the following analyses: 1. Calculate the amount of sales by the experimental condition. (Recall that this is a cross-tabulation calculation.) Does there appear to be a pattern? 2. Determine whether the presence or absence of the sample impacted overall sales. (To do this, you will need to perform an F-test.) Is the result signifi- cant? What conclusion do you draw from this finding? 3. Calculate the correlations between hunger ratings and overall sales. Is the correlation significant? Is the correlation negative or positive? With this conclusion in hand, speculate on what potential role a person's hunger may play on the results of the experiment. (Hint: this is called moderation.) Draw a graph to show the possible relationship
Step by Step Solution
There are 3 Steps involved in it

Get step-by-step solutions from verified subject matter experts