

Question: Yummy Lunch Restaurant needs to decide the most profitable location for their business expansion. Marketing manager plans to use a multiple regression model to achieve
Yummy Lunch Restaurant needs to decide the most profitable location for their business expansion. Marketing manager plans to use a multiple regression model to achieve their target. His model considers yearly revenue as the dependent variable. He found that number of people within 2KM (People), Mean household income(income), no of competitors and price as explanatory variables of company yearly revenue.
The following is the descriptive statistics and regression output from Excel.
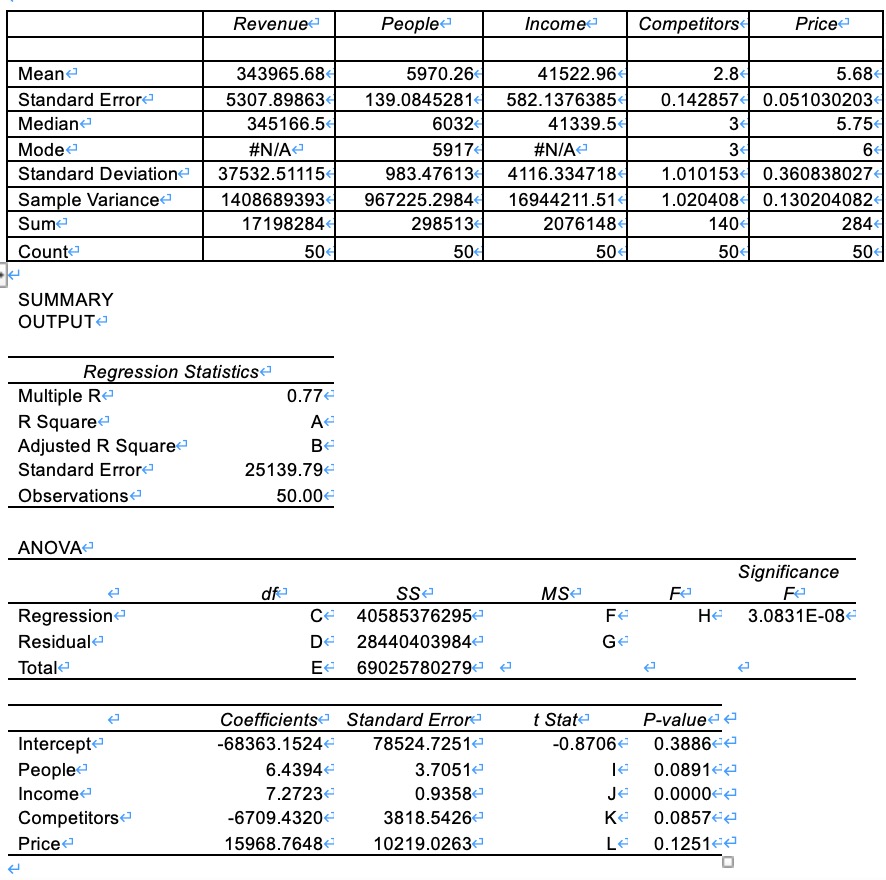
Revenue People Income Competitors Prices Meant 343965.68 5970.26 41522.96 2.8 5.68 Standard Error 5307.89863 139.0845281 582.1376385 0.142857 0.051030203 Median 345166.5 6032 1339.5 3 5.75 Mode #N/A 5917 #N/A- 3 6 Standard Deviation 37532.51115 983.47613 4116.334718 1.010153 0.360838027 Sample Variance 1408689393 967225.2984 16944211.51- 1.020408 0. 130204082 Sume 17198284 298513 2076148 140 284 Count 50 50 50 50 50 SUMMARY OUTPUT Regression Statistics Multiple Re 0.776 R Square Adjusted R Square Be Standard Error 25139.79- Observations 50.00- ANOVA~ Significance df Regression C- 40585376295( Fe He 3.0831E-08- Residual D 28440403984- Ge Total E- 69025780279- Coefficients Standard Error- t State P-value-+ Intercept -68363.1524- 78524.7251- -0.8706- 0.3886-( People 6.4394- 3.7051- 0.0891- Income 7.2723- 0.9358- Je 0.0000 Competitors -6709.4320- 3818.5426- 0.0857-( Price 15968.7648- 10219.0263- Le 0.1251- 0
Step by Step Solution
There are 3 Steps involved in it

Get step-by-step solutions from verified subject matter experts