

Question: Zofer to Iakes S.1. Factors for Computing Constol Chart Limits, (3 sigma) for this problem. A procoss that is considered to be in control measures
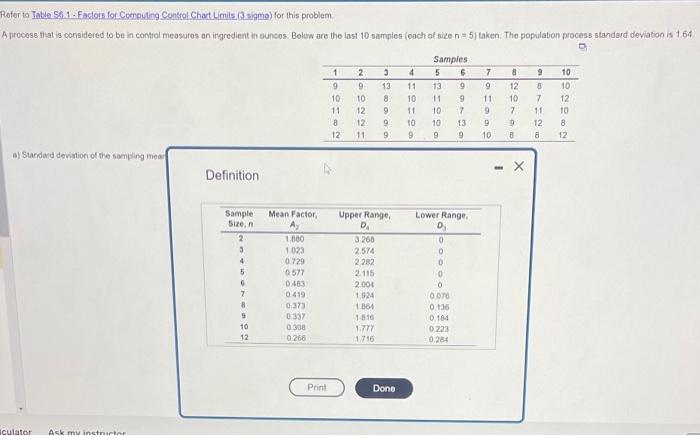
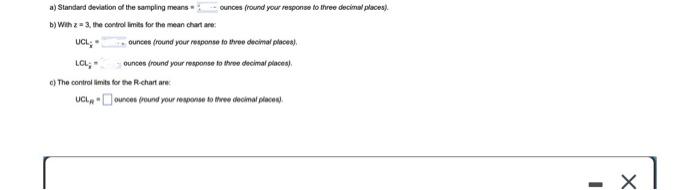
Zofer to Iakes S.1. Factors for Computing Constol Chart Limits, (3 sigma) for this problem. A procoss that is considered to be in control measures an ingredient in ouncos. Below are the iast 10 samples (oach of fize n=5 ) taken. The population process standard deviaton is 1.64 a) Standard devistion of the sampling mear Definition a) Standard deviation of the samping means : cunces (round your response to three decimal places). b) Wih 2=3, the certrol imies for the mean chart are: UCL: " ounces (round your response to thee dweinal places), LCLj= ounces (round your response to thee doeimat places). e) The control limis for the R-chart are: UCLN * ounces pround pour response to the decmal placed
Step by Step Solution
There are 3 Steps involved in it

Get step-by-step solutions from verified subject matter experts