

Question: Access the file QUANTITY OF TEA. It contains data for the amount of tea purchased in 50 different cities during a selected month of the
Access the file QUANTITY OF TEA. It contains data for the amount of tea purchased in 50 different cities during a selected month of the year 2009 in Ireland and the prices of both tea and coffee. Estimate and discuss a model to explain the quantity of tea based on the prices of tea and coffee. Determine the price elasticities associated with each commodity. Explain the signs of the coefficients for both prices.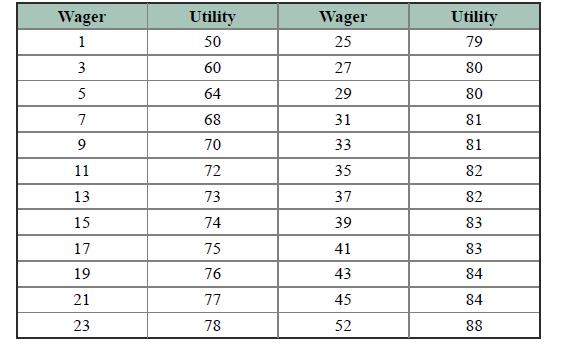
Wager 1 3 5 7 9 11 13 15 17 19 21 23 Utility 50 60 64 68 70 72 73 74 75 76 77 78 Wager 25 27 29 31 33 35 37 39 41 43 45 52 Utility 79 80 80 81 81 82 82 83 83 84 84 88
Step by Step Solution
3.43 Rating (153 Votes )
There are 3 Steps involved in it

Get step-by-step solutions from verified subject matter experts