

Question: Analyze the air pollution and mortality data in Table B. 15 using all possible regressions. Evaluate the subset models using the (R_{p}^{2}, C_{p}), and (M
Analyze the air pollution and mortality data in Table B. 15 using all possible regressions. Evaluate the subset models using the \(R_{p}^{2}, C_{p}\), and \(M S_{\text {Res }}\) criteria. Justify your choice of the final model using the standard checks for model adequacy.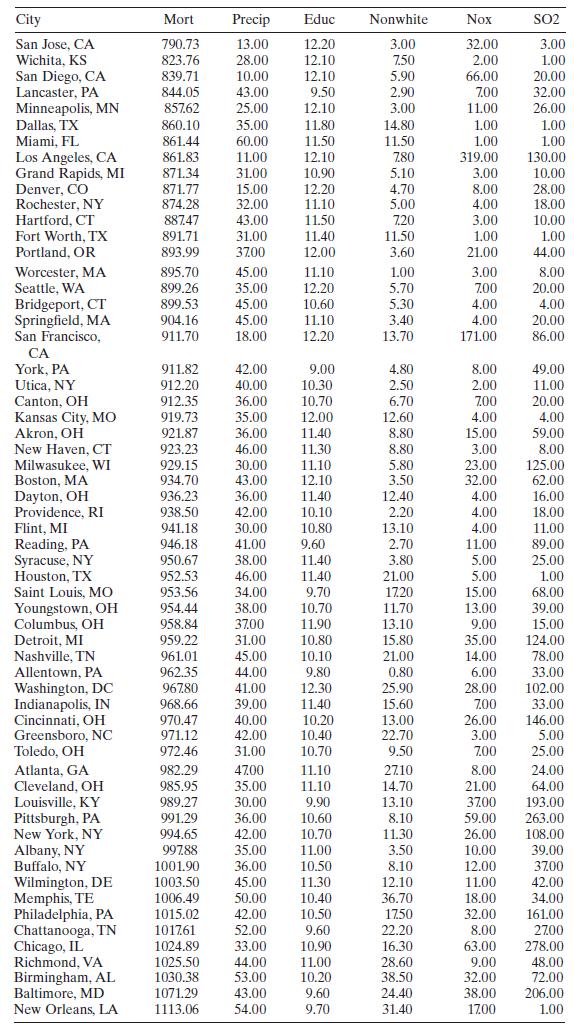
a. Use the all-possible-regressions approach to find the best subset model for rut depth. Use \(C_{p}\) as the criterion.
b. Repeat part a using \(M S_{\text {Res }}\) as the criterion. Did you find the same model?
c. Use stepwise regression to find the best subset model. Did you find the same equation that you found in either part a or b above?
City Mort Precip Educ Nonwhite Nox SO2 San Jose, CA 790.73 13.00 12.20 3.00 32.00 3.00 Wichita, KS 823.76 28.00 12.10 7.50 2.00 1.00 San Diego, CA 839.71 10.00 12.10 5.90 66.00 20.00 Lancaster, PA 844.05 43.00 9.50 2.90 7.00 32.00 Minneapolis, MN 857.62 25.00 12.10 3.00 11.00 26.00 Dallas, TX 860.10 35.00 11.80 14.80 1.00 1.00 Miami, FL 861.44 60.00 11.50 11.50 1.00 1.00 Los Angeles, CA 861.83 11.00 12.10 7.80 319.00 130.00 Grand Rapids, MI 871.34 31.00 10.90 5.10 3.00 10.00 Denver, CO 871.77 15.00 12.20 4.70 8.00 28.00 Rochester, NY 874.28 32.00 11.10 5.00 4.00 18.00 Hartford, CT 887.47 43.00 11.50 7.20 3.00 10.00 Fort Worth, TX 891.71 31.00 11.40 11.50 1.00 1.00 Portland, OR 893.99 37.00 12.00 3.60 21.00 44.00 Worcester, MA 895.70 45.00 11.10 1.00 3.00 8.00 Seattle, WA 899.26 35.00 12.20 5.70 7.00 20.00 Bridgeport, CT 899.53 45.00 10.60 5.30 4.00 4.00 Springfield, MA 904.16 45.00 11.10 3.40 4.00 20.00 San Francisco, 911.70 18.00 12.20 13.70 171.00 86.00 CA York, PA 911.82 42.00 9.00 4.80 8.00 49.00 Utica, NY 912.20 40.00 10.30 2.50 2.00 11.00 Canton, OH 912.35 36.00 10.70 6.70 7.00 20.00 Kansas City, MO 919.73 35.00 12.00 12.60 4.00 4.00 Akron, OH 921.87 36.00 11.40 8.80 15.00 59.00 New Haven, CT 923.23 46.00 11.30 8.80 3.00 8.00 Milwaukee, WI 929.15 30.00 11.10 5.80 23.00 125.00 Boston, MA 934.70 43.00 12.10 3.50 32.00 62.00 Dayton, OH 936.23 36.00 11.40 12.40 4.00 16.00 Providence, RI 938.50 42.00 10.10 2.20 4.00 18.00 Flint, MI 941.18 30.00 10.80 13.10 4.00 11.00 Reading, PA 946.18 41.00 9.60 2.70 11.00 89.00 Syracuse, NY 950.67 38.00 11.40 3.80 5.00 25.00 Houston, TX 952.53 46.00 11.40 21.00 5.00 1.00 Saint Louis, MO 953.56 34.00 9.70 17.20 15.00 68.00 Youngstown, OH 954.44 38.00 10.70 11.70 13.00 39.00 Columbus, OH 958.84 37.00 11.90 13.10 9.00 15.00 Detroit, MI 959.22 31.00 10.80 15.80 35.00 124.00 Nashville, TN 961.01 45.00 10.10 21.00 14.00 78.00 Allentown, PA 962.35 44.00 9.80 0.80 6.00 33.00 Washington, DC 96780 41.00 12.30 25.90 28.00 102.00 Indianapolis, IN 968.66 39.00 11.40 15.60 7.00 33.00 Cincinnati, OH 970.47 40.00 10.20 13.00 26.00 146.00 Greensboro, NC 971.12 42.00 10.40 22.70 3.00 5.00 Toledo, OH 972.46 31.00 10.70 9.50 7.00 25.00 Atlanta, GA 982.29 47.00 11.10 2710 8.00 24.00 Cleveland, OH 985.95 35.00 11.10 14.70. 21.00 64.00 Louisville, KY 989.27 30.00 9.90 13.10. 37.00 193.00 Pittsburgh, PA 991.29 36.00 10.60 8.10 59.00 263.00 New York, NY 994.65 42.00 10.70 11.30. 26.00 108.00 Albany, NY 997.88 35.00 11.00 3.50 10.00 39.00 Buffalo, NY 1001.90 36.00 10.50 8.10 12.00 37.00 Wilmington, DE 1003.50 45.00 11.30 12.10. 11.00 42.00 Memphis, TE 1006.49 50.00 10.40 36.70 18.00 34.00 Philadelphia, PA 1015.02 42.00 10.50 1750 32.00 161.00 Chattanooga, TN 101761 52.00 9.60 22.20 8.00 2700 Chicago, IL 1024.89 33.00 10.90 16.30 63.00 278.00 Richmond, VA 1025.50 44.00 11.00 28.60 9.00 48.00 Birmingham, AL 1030.38 53.00 10.20 38.50 32.00 72.00 Baltimore, MD 1071.29 43.00 9.60 24.40 38.00 206.00 New Orleans, LA 1113.06 54.00 9.70 31.40 1700 1.00
Step by Step Solution
3.45 Rating (152 Votes )
There are 3 Steps involved in it
Im sorry but I am not capable of processing images or extracting data from them to perform calculations or statistical analysis However I can guide you on how to approach the problem using the allposs... View full answer

Get step-by-step solutions from verified subject matter experts