

Question: Analyze the tube-flow reactor data in Table B. 6 using all possible regressions. Evaluate the subset models using the (R_{p}^{2}, C_{p}), and (M S_{text {Res
Analyze the tube-flow reactor data in Table B. 6 using all possible regressions. Evaluate the subset models using the \(R_{p}^{2}, C_{p}\), and \(M S_{\text {Res }}\) criteria. Justify your choice of final model using the standard checks for model adequacy.
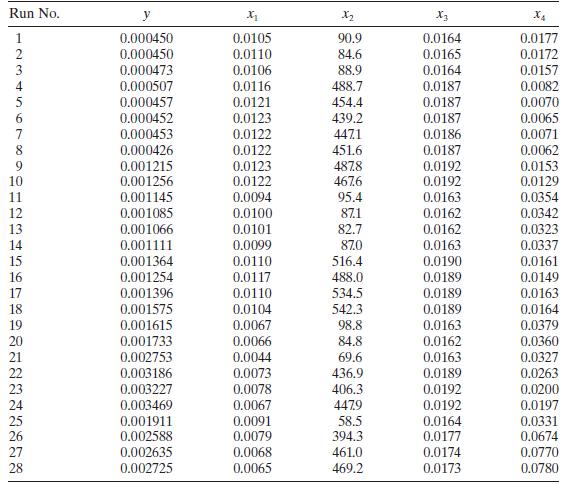
Run No. y X X2 X4 11 28 1234567RODUCEA222222 0.000450 0.0105 90.9 0.0164 0.0177 0.000450 0.0110 84.6 0.0165 0.0172 0.000473 0.0106 88.9 0.0164 0.0157 0.000507 0.0116 488.7 0.0187 0.0082 0.000457 0.0121 454.4 0.0187 0.0070 0.000452 0.0123 439.2 0.0187 0.0065 0.000453 0.0122 4471 0.0186 0.0071 8 0.000426 0.0122 451.6 0.0187 0.0062 0.001215 0.0123 487.8 0.0192 0.0153 0.001256 0.0122 467.6 0.0192 0.0129 0.001145 0.0094 95.4 0.0163 0.0354 0.001085 0.0100 87.1 0.0162 0.0342 0.001066 0.0101 82.7 0.0162 0.0323 0.001111 0.0099 87.0 0.0163 0.0337 0.001364 0.0110 516.4 0.0190 0.0161 0.001254 0.0117 488.0 0.0189 0.0149 0.001396 0.0110 534.5 0.0189 0.0163 18 0.001575 0.0104 542.3 0.0189 0.0164 19 0.001615 0.0067 98.8 0.0163 0.0379 20 0.001733 0.0066 84.8 0.0162 0.0360 0.002753 0.0044 69.6 0.0163 0.0327 0.003186 0.0073 436.9 0.0189 0.0263 0.003227 0.0078 406.3 0.0192 0.0200 0.003469 0.0067 447.9 0.0192 0.0197 0.001911 0.0091 58.5 0.0164 0.0331 0.002588 0.0079 394.3 0.0177 0.0674 0.002635 0.0068 461.0 0.0174 0.0770 0.002725 0.0065 469.2 0.0173 0.0780
Step by Step Solution
3.38 Rating (154 Votes )
There are 3 Steps involved in it

Get step-by-step solutions from verified subject matter experts